This site uses cookies to improve your experience. To help us insure we adhere to various privacy regulations, please select your country/region of residence. If you do not select a country, we will assume you are from the United States. Select your Cookie Settings or view our Privacy Policy and Terms of Use.
Cookie Settings
Cookies and similar technologies are used on this website for proper function of the website, for tracking performance analytics and for marketing purposes. We and some of our third-party providers may use cookie data for various purposes. Please review the cookie settings below and choose your preference.
Used for the proper function of the website
Used for monitoring website traffic and interactions
Cookie Settings
Cookies and similar technologies are used on this website for proper function of the website, for tracking performance analytics and for marketing purposes. We and some of our third-party providers may use cookie data for various purposes. Please review the cookie settings below and choose your preference.
Strictly Necessary: Used for the proper function of the website
Performance/Analytics: Used for monitoring website traffic and interactions
A report released Monday by the National Association of Realtors (NAR) showed an increase in pending home sales for the fourth consecutive month. NAR’s Pending Homes Sales Index (PHSI) report is a forward-looking source that predicts home sales based on contract signings. The report found that pending home sales jumped 2.2%
The National Association of REALTORS (NAR) reports that pending home sales increased in September. increase in the Pending Home Sales Index (PHSI), a measure of future home sales based on contract signings, to 75.8, increase in the Pending Home Sales Index (PHSI), a measure of future home sales based on contract signings, to 75.8,
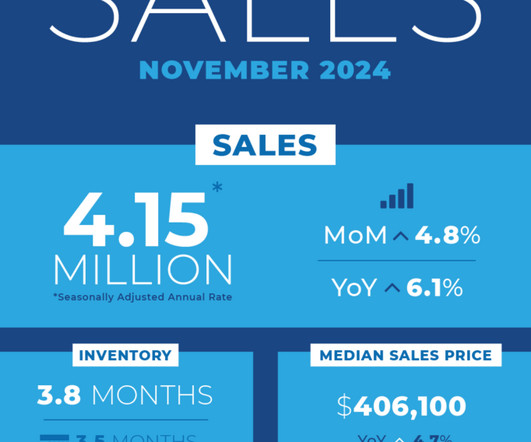
The National Association of Realtors reports that existing-home sales increased in November. More buyers have entered the market as the economy continues to add jobs, housing inventory grows compared to a year ago, and consumers get used to a new normal of mortgage rates between 6% and 7%. Three major U.S. from October to 4.15
The difference is mortgage rates: even with inventory growing at a healthy clip this year, mortgage rates just heading down toward 6% for a brief period of time resulted in higher prices in a seasonally soft period. Home prices firming up with higher inventory and mortgage rates just getting toward 6% is a lesson learned in 2024 for 2025.
After eight months of consecutive gains, the consequences of low inventory finally caught up with the housing market in February. drop in the number of homes in contract from the prior month, according to new data from the National Association of Realtors. Tightened supply was largely responsible for a 10.6% and West (96.9)
Pending home sales rose in October, marking the third consecutive month of increases, according to new data from the National Association of Realtors (NAR). NAR’s Pending Home Sales Index (PHSI)–a forward-looking indicator of home sales based on contract signings–rose 2% to 77.4 in October. week-over-week. in October, up 2.5%
Like new and existing sales, pending home sales felt the strain of exhausted home inventory in April ? according to Thursday data from the National Association of Realtors. The upper-end market is still moving sharply as inventory is more plentiful there.”. dropping 4.4% from the previous month to an index of 106.2,
Available inventory of homes for sale is on the rise in late September, which is very unusual for this time of year. In fact, inventory is growing faster than this time a year ago. What’s happening with inventory? Normally by this point in September, available inventory is declining slightly each week.
As a real estate reporter, it was not lost on me that the formal start of my house hunt would coincide almost perfectly with the real estate industry working through the nationwide implementation of the business practice changes outlined in the National Association of Realtors ‘ (NAR) commission lawsuit settlement agreement.
Taking the top spot as the greatest challenge was low inventory , with nearly half (49%) of respondents ranking that as their biggest challenge. Most buyers here cannot pay realtor commissions because they are VA (Veterans Affairs borrowers).” In a similar vein, “getting listings” was the third-largest hurdle cited by agents.
decline in pending home sales, according to the National Association of REALTORS. A forward-looking measure of home sales based on contract signings, the Pending Home Sales Index (PHSI) fell to 70.2 The level of contract activity in 2001 is represented by an index of 100. “A July saw a 5.5% Pending transactions decreased by 8.5%
According to the National Association of Realtors , contract signings kicked off strong in August , with the most contract signings last week in the Midwest, at 21%. Homes on the market sold four days faster year over year, as total inventory is down 35%. Now, agents are showing and selling nonstop.
The monthly Realtors Confidence Index helps to dispel many of the myths and cut through the noise of what is currently happening in the market. The National Association of Realtors Research Group has produced the index since 2008, at a time of turmoil in the real estate market. In comparison, in 2011, homes took 96 days to sell. .
compared with January 2024, according to the National Association of Realtors (NAR). Month-over-month, contract signings retreated in the Midwest, South and West, while the Northeast saw a slight increase. Year-over-year, contract signings decreased in all four U.S. Pending home sales fell 4.6%
Unlike many other metropolitan areas across the country , the housing market in Southwest Florida is comparably flush with for-sale inventory. “I We are seeing a healthy increase in inventory, which we really needed.” Smith attributes the uptick in inventory to a bump in new listings.
in October – the second consecutive month the index has fallen as affordability strains the market, a recent report from the National Association of Realtors said. However, borrowers are still maintaining a strong pace, as contract signings are up 20.2% pending home sales fell 1.1% compared to a year ago. Presented by: Fannie Mae.
After rising in March , pending home sales continued to slide in May, with the Pending Home Sales Index (PHSI) posting its second consecutive month of declines to reach a record low, according to data released Thursday by the National Association of Realtors (NAR). An index of 100 is equal to the level of contract activity in 2001.
The seasonally-adjusted index measuring signed contracts was up 15.5% year over year, largely on the back of pent-up demand from buyers who were unable to strike deals during the spring, said Lawrence Yun, chief economist of the National Association of Realtors. “We pending home sales rose 5.9% million, a 1.1% gain compared with 2019.
in April compared to March as rising mortgage rates weighed on the market, according to data released Thursday by the National Association of Realtors (NAR). The impact of escalating interest rates throughout April dampened home buying, even with more inventory in the market,” NAR chief economist Lawrence Yun said in a statement.
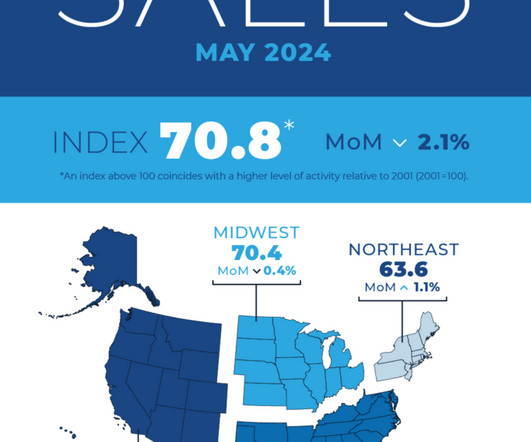
After plummeting to an all-time low in May , pending home sales bounced back a bit in June, with the Pending Home Sales Index rising 4.8%, according to data released Wednesday by the National Association of Realtors (NAR). A reading of 100 is equal to the level of contract activity in 2001. The index rose from a reading of 70.8
year-over-year, according to a report from the National Association of Realtors. Year-over-year, contract signings increased by 16.4%. “The latest monthly decline is largely due to the shortage of inventory and fast-rising home prices,” said Lawrence Yun, NAR’s chief economist. Presented by: WFG.
Weekly pending contracts Now that we see how sales can grow with mortgage demand and purchase applications, let’s look at how it tracks into our weekly pending contract data. We have observed that pending contracts improved when mortgage rates dropped to around 6%.
month over month, according to the newest data released Thursday by the National Association of Realtors (NAR). For comparison, the index is benchmarked at a reading of 100 based on 2001 contract activity. Ongoing job gains are clearly increasing demand along with more inventory.” Overall, active inventory grew 14.8%
A new report from the National Association of Realtors (NAR) has found that pending home sales gained 2.2% Year-over-year, contract signings increased in all four U.S. NARs Pending Home Sales Index (PHSI)a forward-looking indicator of home sales based on contract signingsadvanced 2.2% regions, with the West leading the pack.
increase was reported in June pending home sales by the National Association of REALTORS (NAR). The rise in housing inventory is beginning to lead to more contract signings,” said Lawrence Yun, NAR Chief Economist. The level of contract activity in 2001 is represented by an index of 100. In a new report, an estimated 4.8%
in July, according to data released Wednesday by the National Association of Realtors (NAR). An index of 100 is equal to the level of contract activity in 2001. However, rising mortgage rates and limited inventory have temporarily hindered the possibility of buying for many.” annual drop recorded in June.
Meanwhile, the marketplace data strongly suggests that an increase of office exclusive listings has the potential to harm prospective buyers and sellers by limiting access to information and creating a fragmented inventory system. DelPrete said exclusive inventory is not exclusive forever, adding that pre-marketing might be a better label.
in September despite significant affordability hurdles weighing on the market, according to data released Thursday by the National Association of Realtors (NAR). Despite the slight gain, pending contracts remain at historically low levels due to the highest mortgage rates in 20 years,” Lawrence Yun, NAR chief economist said in a statement.
Realtors can usually count on their biggest season being spring, followed by summer, but nothing about 2020 has been normal, including home-buying patterns. ” Kanacki’s market, like many others, remains competitive as buyers continue to experience bidding wars amid historically low housing inventory and an uptick in home prices.
Last week, the National Association of Realtors released their December pending sales data. Homes in contract rises There are more homes in contract now than last year at this time. Sales growth is not guaranteed This week there were 56,000 contracts started for single-family home purchases. So, this growth is fragile.
month over month in December, according to the newest data from the National Association of Realtors (NAR). For comparison, the index is benchmarked at a reading of 100 based on 2001 contract activity. New home sales , another measure of contract signings, rose 8% in December on the back of declining mortgage rates. in November.
month over month in January, according to the newest data from the National Association of Realtors (NAR). For comparison, the index is benchmarked at a reading of 100 based on 2001 contract activity. Overall active inventory improved 7.9% Pending home sales dropped 4.9% NAR’s Pending Home Sales Index (PHSI) decreased to 74.3
The last year has been a completely split housing market — one that started with the lowest inventory NAR has recorded dating back to 1999 and one with low mortgage rates. The market has now faced a contraction in existing-homes sales for nine consecutive months, while home prices and rates rise.
An index level of 100 is equal to the level of contract activity in 2001. Contract transactions slowed a bit in September and are showing signs of a calmer home price trend, as the market is running comfortably ahead of pre-pandemic activity,” Lawrence Yun, NAR’s chief economist, said in a statement. in 2022.
month-over-month decrease, according to data released Thursday by the National Association of Realtors (NAR). An index of 100 is equal to the level of contract activity in 2001. The lack of housing inventory is a major constraint to rising sales,” Lawrence Yun , NAR’s chief economist, said in a statement. year over year.
decline in pending home sales, according to the National Association of REALTORS. Indicator of prospective home sales based on contract signings, the Pending Home Sales Index (PHSI) dropped to 70.8 The level of contract activity in 2001 is represented by an index of 100. May saw a 2.1% Per the report, every U.S.
As the calendar has turned to May, and the Realtor Legislative Meetings have come to a close, it’s a good time to reflect on research that was released last month and throughout early 2022. The report used real time listing data to show the limited housing inventory and the repercussions to home buyers.
After falling for the first time since November 2022 in March , pending home sales remained unchanged in April, according to data released Thursday by the National Association of Realtors (NAR). An index of 100 is equal to the level of contract activity in 2001. annual drop recorded in March.
million, according to the N ational Association of Realtors. Homes typically go under contract a month or two before the closing, which means the October data largely reflects purchase decisions made in August and September. On the bright side, housing inventory rose 1.8% On the bright side, housing inventory rose 1.8%
From the National Association of Realtors : “The Pending Home Sales Index (PHSI), a forward-looking indicator of home sales based on contract signings, rose 7.5% An index of 100 is equal to the level of contract activity in 2001.” When inventory rises and more supply is on the market, this means demand is fading.
Homebuyer contract signings in the U.S. Increased inventory of homes for sale, near historic low mortgage rates and favorable demographics means more housing demand, ” Odeta Kushi, the First American deputy chief economist said in a statement. rose 8% month-over-month from July to August, though the figure was still 8.3%
After holding steady month over month in April , pending home sales were back down again in May, dropping 2.7%, according to data released Thursday by the National Association of Realtors (NAR). An index of 100 is equal to the level of contract activity in 2001. annual drop recorded in April.
in August, according to data released Thursday by the National Association of Realtors (NAR). An index of 100 is equal to the level of contract activity in 2001. Pending home sales, like new home sales, are based on contract signings. Mirroring the trend for new home sales , pending home sales fell 7.1%
In August, pending home sales , existing home sales and new home sales all fell compared to the previous month, as mortgage rates climbed and inventory remained scarce. in September year over year to $394,300, according to the National Association of Realtors. During the first week of June, mortgage rates were at 6.79%.
We organize all of the trending information in your field so you don't have to. Join 9,000+ users and stay up to date on the latest articles your peers are reading.
You know about us, now we want to get to know you!
Let's personalize your content
Let's get even more personalized
We recognize your account from another site in our network, please click 'Send Email' below to continue with verifying your account and setting a password.


Let's personalize your content