This site uses cookies to improve your experience. To help us insure we adhere to various privacy regulations, please select your country/region of residence. If you do not select a country, we will assume you are from the United States. Select your Cookie Settings or view our Privacy Policy and Terms of Use.
Cookie Settings
Cookies and similar technologies are used on this website for proper function of the website, for tracking performance analytics and for marketing purposes. We and some of our third-party providers may use cookie data for various purposes. Please review the cookie settings below and choose your preference.
Used for the proper function of the website
Used for monitoring website traffic and interactions
Cookie Settings
Cookies and similar technologies are used on this website for proper function of the website, for tracking performance analytics and for marketing purposes. We and some of our third-party providers may use cookie data for various purposes. Please review the cookie settings below and choose your preference.
Strictly Necessary: Used for the proper function of the website
Performance/Analytics: Used for monitoring website traffic and interactions
Potential home sellers notice weak demand, fewer offers and price reductions, prompting them to back away from the market. If potential sellers avoid the market, this will keep a lid on supply growth. Newlistings are hitting the market Last year was an environment with 5% to 10% more sellers each week than a year prior.
There were 45,000 newlistings for single-family homes across the country this week, which is a big jump. That’s 12% more sellers than a year ago. It seems more sellers are coming out every week and that will keep inventory pushing upward. Sellers are up, but sales are down. Home prices could fall.
All the housing market data for 2024 is in, and its fair to say that the housing market surprised us again! However, there are two big trends that stand out as we launch into 2025 affordability and sellers in the market. The other trend to watch is whether we finally have more sellers entering the market in 2025.
As inventory builds and, as there are fewer offers from homebuyers , more sellers feel the need to reduce the asking price of the homes for sale. We regard this metric, the percentage of homes on the market with price reductions from the original list price, as a leading indicator for future sales prices. About 33.1% There are 27.7%
Additionally, our weekly pending contract data and newlistings are trending positively compared to last year. Stay alert for breaking news. Mortgage spreads Mortgage spreads started showing positive trends in 2024 and have continued up until last week.
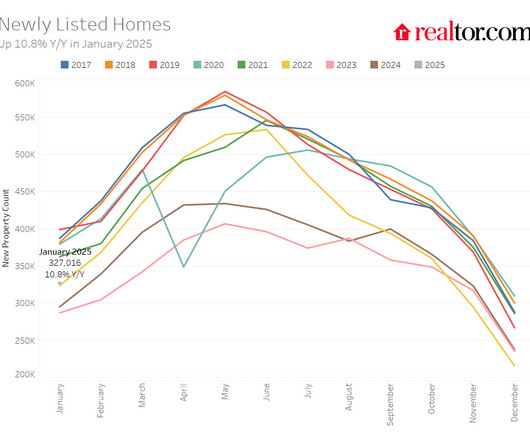
According to the Realtor.com January Monthly Housing Report, January saw a positive shift in seller activity despite recent hikes in mortgage rates, with the number of newly listed homes increasing 37.5% The number of newly listed houses was 10.8% The number of newly listed houses was 10.8% Active listings +25.3% -25.3%
Newlistings grew 7% from the week prior Last week saw 68,000 newly listed single-family homes. As such, the pace of newlistings seems to be picking up for the spring and the post-pandemic era. There were nearly 7% more sellers last week than the week prior. What is driving the sellers’ behavior?
Newlistings were unchanged at 54,077. Redfin considers four to five months of supply as balanced, with a lower number suggesting ideal sellers market conditions. Pending home sales sat at 58,267 for the four weeks, marking a year-over-year change of -3.4% the first drop in three months, per Redfin’s data.
In 2024, we saw a notable increase in buyer demand when mortgage rates got close to 6%. However, mortgage rates were climbing to their highest level of the year at this time in 2024. Newlistings To get a lot of homes on the market though we need some sellers. Unsold newlistings amount to 4.8%
at the end of 2024. ’s inventory level compared to 2024. more homes on the market than 2024. Newlistings move upward, but remain historically low Altos uses new real estate listings data as a key indicator of seller activity in the D.C According to the U.S. over the same timeframe.
One of my critical forecasts for 2024 was the growth of newlistings data and active inventory, even with higher mortgage rates. However, the newlistings data has slightly disappointed me. Newlistings data I am pleased that we’ve seen newlistings data grow year over year — it’s a big step forward.
10-year yield and mortgage rates My 2024 forecast included: A range for mortgage rates between 7.25%-5.75% A range for the 10-year yield between 4.25%-3.21% This week was relatively calm for mortgage rates as the 10-year yield continues to hold steady at a critical level, which ranges from 4.40% to 4.50%. Weekly inventory change (Nov.
This is measurable in both the total unsold inventory and the number of newlistings each week. Because each week we have 815% more sellers than last year, the total inventory will continue to build unless and until demand shifts dramatically, which would require notably lower mortgage rates. Those do not seem imminent.
The New Years week was expected to be slow, so it’s no surprise that newlistings and sales are down. The Christmas and New Year’s holidays fell on Wednesdays this year, which messes up two full weeks in terms of getting home sales done and tracking the numbers. Those will start rebounding in next weeks data.
Let’s take a look at the data for the end of October 2024. Florida had an uptick in inventory with a bit of a rebound in newlistings now that the storms are over. Newlistings go up This year continues to have slightly more sellers than last year but fewer than we used to get in past years.
We already see many signals for what to expect, including last week’s data on inventory , newlistings and price reductions, which I analyze below. Newlistings One way reason it will be hard for inventory to grow more than 17% next year is that there are still not enough sellers to get there. price cut.
Newlistings volume is trying to grow with its biggest week since September. List prices inched up for the week, though sales prices did not advance. This year still has fewer home sales than 2024 at this time. See the purple line for 2025 keeps coming in just below 2024. Thats up 1.2% This was a jump of 2.5%
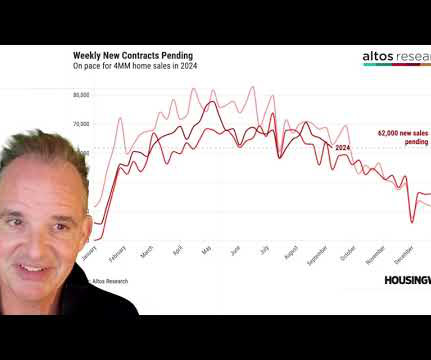
New contracts for home purchases are coming in very low this month. In the fourth quarter of 2024, sales were coming in at 5% to 10% more than the year prior. When the market is hot like during the Pandemic there were more buyers than sellers in Q1 so inventory kept declining until March or April. Thats been changing.
Weekly housing inventory data Four weeks ago was the best week of inventory growth in 2024, as we hit my model range without higher mortgage rates : I gave it the chef’s kiss. Remember that 2023 had the lowest newlistings data ever and 2024 will have the second lowest. Still, at least we saw growth in 2024.
This is after Q4 2024 was 5% above the year prior. In fact, as of the end of February, the sales and home price data continue to look very weak, even compared to the lows of 2024. The purple line in this chart is 2025, you can see that nationally there are plenty more homes unsold on the market than 2024.
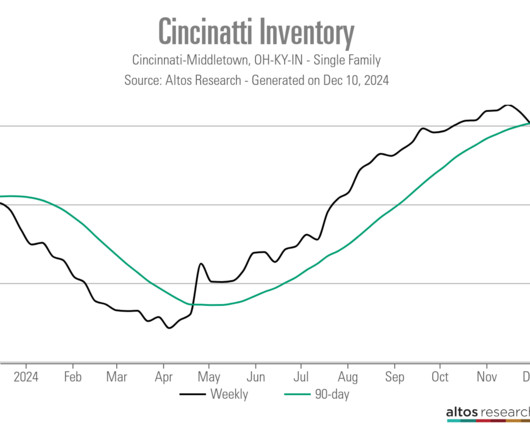
Let’s take a look at the data as we’re already in November 2024. The unsold supply of homes on the market has now passed its peak for 2024. Newlistings rise There were just under 61,000 newlistings unsold this week. When you include the 9,400 immediate sales, the total is 13% more sellers than a year ago.
Demand for “have-it-all” properties and the “forever dream home” will shape this spring’s luxury housing market, according to the Coldwell Banker Global Luxury 2024 Mid-Year Trend Report , which forecasts growing optimism among affluent consumers and an influx of desirable inventory. of responding specialists agreed. Among specialists, 32.8%
Lets take a look at the data as were now in December 2024. Supply growth could also come from more sellers, such as investors or distressed borrowers unloading. However, in most of the country, we have no growth from the seller side. Weve been averaging about 8% more sellers each week than a year ago.
in December 2024 when compared to the same period the previous year. metro areas, Miami (45.4%), San Diego (42.4%), and Denver (41.9%) had the biggest annual rise in active listings. of sellers lowering their prices in Decemberup just a little from 12.7% 2019 Median listing price -1.8% (to $402,502) +34.2% With 12.9%
Notably, the median sale price in the Pacific Palisades jumped by 32% since February 2024. While sales tanked and prices shifted, newlistings slowed. In the Palisades, there were 23 newlistings in February 2025, down 12% year over year. Altadena, meanwhile, posted a 6% decline in newlistings.
The rules of supply and demand economics always end up winning and weekly newlisting data is key. Newlisting data is growing year over year, but it will be the second-lowest newlisting data ever recorded in history. 2024 has a much healthier inventory level.
Its a symptom of a market thats transitioning away from sellers. A substantial drop in newlistings is a contributing factor. 1, weekly newlistings were at 410 but have since dropped to 186, although newlistings tend to drop in December as the holidays approach.
The weekly volume of newlistings is now higher than at anytime last year. It’s still April, so there could be as many as eight more weeks of seller growth in the spring housing market. And seller growth is happening pretty much everywhere across the country, with Florida and Texas leading the way. orate further?
We’re also seeing more home sellers withdrawing their listings to try again next year. In fact, for every two sales, there is another listing withdrawn from the market. Newlistings at the peak for the year There are two reasons that inventory is probably around the peak for the year.
Now its pretty clear that sellers arent slashing asking prices and mortgage rates arent plummeting, so mindsets are shifting. Key findings from the four weeks ending January 26: Before the seller accepted an offer, the average U.S. Active listings 889,202 11.3% (smallest increase in nearly a year) Months of supply 5.2 +0.3
“Mortgage interest rates above 6% continued to impact potential homebuyers’ purchase power, while also contributing to a lock-in effect among would-be home sellers who bought their homes years ago with a mortgage rate of 3% to 4.5%,” the association explained in an announcement. “Newlistings of single-family homes were up 16.7%
But nationally, home prices are still higher year over year, and some places like New York state had significant home-price gains in 2024 due to persistently tight inventory. Following that, 2024 started a bit higher still. Home sellers and listing agents know where demand is for homes. from last week and 26.5%
annually in December 2024, up from a 3.7% during the last six months of 2024. New York City continued to demonstrate strength in home prices, up 7.2% “Mortgage rates nearing 7% in January seem to have affected buyers more than sellers,” Zillow senior economist Kara Ng said. Home prices were up 3.9% ”
Newlistings When we look at the sellers entering the market, there were 45,000 newlistings last week. That is 14% more home sellerslisting their properties in December than the same week a year ago. This quantity of sellers is more similar to the pre-pandemic years than weve seen in a long time.
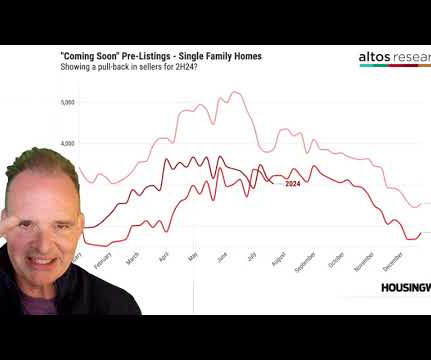
Our Immediate sales measure of homes that get listed, take offers and go into contract in a few days is also notably lower than last year. On the supply side, newlistings are slightly more than a year ago, but pulling back. If fact the “coming soon” pre-listings are now running behind last year by 5%. That’s up 1.3%
Now that Thanksgiving is behind us and December is well under way, we can start looking ahead to the 2024 housing market. Newlistings and home sales remain low this week while available inventory of unsold homes is finally falling across the country after rising with mortgage rates late into November. housing market in 2024.
Newlistings remain low as owners lock in Altos’s data for newlistings accounts for single-family homes that come to market without an immediate or pending contract. Newlistings for single-family homes or condos are key indicators of seller behavior and newlistings ramped up during the week of Feb.
That pretty much describes sellers. But in 2024 there’s a flicker of hope as sellers have thawed out just a bit. UPCOMING (PUBLIC) SPEAKING GIGS: 01/31/24 Joel Wright […] The post Are sellers finally starting to thaw out? Any thoughts?
Home sellers are returning to the market, but buyers are hesitant, according to a recent Zillow market report. In May, new property listings exceeded sales, allowing buyer competition and price rise to slow—and more price relief is expected. Inventory, NewListings and Pending Sales Overview Newlistings increased by 7.9%
There’s a showdown at the housing market corral between homebuyers and sellers. From NAR: One of the essential variables I added to my work during 2020-2024 was to put an effective price-growth model for this period to know when the housing market would get into price inflation trouble. Image by Brandon Johnson/HW Media.).
Active listings of homes for sale rose to the highest level since early in the pandemic. Newlistings hit the highest level since July 2022, increasing 1.9% I have sellers saying, I think were at the top of the marketIm ready to cash out and put my money into another investment. They climbed 0.3% year-over-year.
Have we seen the bottom in mortgage rates for 2024 after a crazy roller coaster ride so far this year? My 2024 forecast had a mortgage rate range of 7.25%-5.75%. With the 10-year yield at 3.74% as of Friday, we have some room left to reach the very bottom of the 2024 forecast before the year is out.
You also know that newlistings are up over last year, too. Newlistings volume is up, too. There were 58,000 newlistings this week, with 10,000 of those homes already under contract as immediate sales. A few more sellers appear to be braving the market each week. Short on time?
Now that mortgage rates have fallen and as we start the brand new year, we need to focus on this data line more. I believe we should get more sellers in 2024 than in 2023, but that doesn’t necessarily mean home prices will fall. Here are the year-over-year price-cut percentages from the first week of the year: 2024 32.8%
We organize all of the trending information in your field so you don't have to. Join 9,000+ users and stay up to date on the latest articles your peers are reading.
You know about us, now we want to get to know you!
Let's personalize your content
Let's get even more personalized
We recognize your account from another site in our network, please click 'Send Email' below to continue with verifying your account and setting a password.


Let's personalize your content