This site uses cookies to improve your experience. To help us insure we adhere to various privacy regulations, please select your country/region of residence. If you do not select a country, we will assume you are from the United States. Select your Cookie Settings or view our Privacy Policy and Terms of Use.
Cookie Settings
Cookies and similar technologies are used on this website for proper function of the website, for tracking performance analytics and for marketing purposes. We and some of our third-party providers may use cookie data for various purposes. Please review the cookie settings below and choose your preference.
Used for the proper function of the website
Used for monitoring website traffic and interactions
Cookie Settings
Cookies and similar technologies are used on this website for proper function of the website, for tracking performance analytics and for marketing purposes. We and some of our third-party providers may use cookie data for various purposes. Please review the cookie settings below and choose your preference.
Strictly Necessary: Used for the proper function of the website
Performance/Analytics: Used for monitoring website traffic and interactions
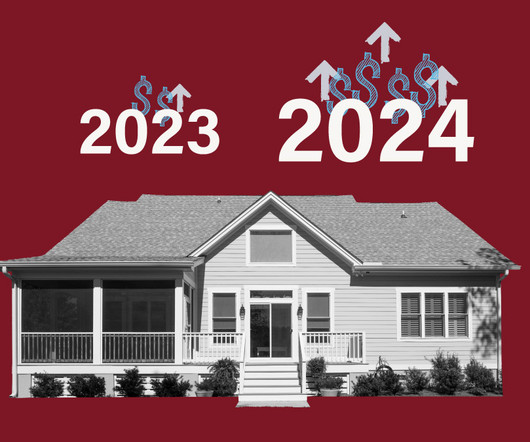
One reason that home prices have stayed elevated is that inventory nationally is still restricted. But if current trends continue, the inventory shortage will be effectively gone by next spring. In fact, while home prices are higher than a year ago, inventory has increased at the rate price appreciation has decreased.
Last year, spring home sellers who put their house up for sale in the second half of May were able to get the most money for it. Sellers can list their house when the most buyers are seeking by focusing on late spring. Sellers might demand a greater price when there is competition among buyers for property.
Housing inventory, which saw an excellent pickup a few weeks ago, has been slowing down and last week we saw a slight decline. Has seasonality finally kicked in or did back-to-back hurricanes slow things enough to influence inventory data? Since then, inventory growth has been slowing down and even declined last week.
Potential home sellers notice weak demand, fewer offers and price reductions, prompting them to back away from the market. As such, housing inventory isn’t shrinking. If potential sellers avoid the market, this will keep a lid on supply growth. This week, the new listings stat has grown with slightly more sellers.
Altos considers anything above 30 to be indicative of a sellers market. In contrast, during the pandemic, the median-price peak jumped from $279,000 in 2019 to $319,000 in 2021 before falling to $310,000 in 2022. There is no inventory, McCormick said. as of Jan. 6, compared to a score of 44.64 a year ago.
Data from Altos Research shows that higher mortgage rates aren’t necessarily keeping sellers from listing their homes. For-sale inventory of single-family homes is up 33% from a year ago. “The current pending sales got a boost from lower mortgage rates last month, but those mortgage gains are gone now.
However, there are two big trends that stand out as we launch into 2025 affordability and sellers in the market. The other trend to watch is whether we finally have more sellers entering the market in 2025. There are some signals that seller volume is starting to creep back to normal levels. fewer than a week prior.
New listings hit the highest level since July 2022, increasing 1.9% Economic uncertainty: With tariffs, reductions in the federal workforce, return to office mandates, and mortgage rate uncertainty, a lot is up in the air for a lot of Americans right now, and Redfin agents report this is giving buyers (and sellers) cold feet.
We track inventory and home sales very closely, so the biggest surprise this year has been the resiliency of home prices. Inventory ticked down this week Inventory ticked down to 738,000 from 739,000 last week. Our model had expected inventory to climb just a bit this week. They have not.
In markets across the South, increased multi-family inventory is easing competition among renters and driving down prices. median rent is still only $17 (-1.0%) below its peak from August 2022, despite the overall fall. from its peak in October 2022. over the same period). The average studio rent decreased by 2.3%
Will inventory levels skyrocket as federal workers leave? Weekly housing inventory ramps up What do we see in the data on housing inventory levels in the D.C. Weekly housing inventory ramps up What do we see in the data on housing inventory levels in the D.C. But inventory remains well below historical averages.
Notably, we compared the data from 2022 and 2023 and noticed positive year-over-year data starting in October 2024, which you can see in the chart below. Active inventory typically decreases at this time of year, but in 2024 it did not drop below 1 million. For me, the highlight of 2024 was the growth in active inventory.
Inventory grew by almost 14,000 homes this week. Available inventory of unsold homes continues to grow but that growth in seems a bit less intense than it could be. Sellers can just wait it out, and it looks like the U.S. I think it’s worth examining if sellers will indeed just wait it out now. Inventory increases by 2.2%
Weekly housing inventory data Last week saw another slight decline in active listing and soon, the holidays will kick in. The seasonal decline is well underway, and it looks like the 739,434 level will be the peak of inventory for 2024. Weekly inventory change (Nov. Weekly inventory change (Nov.
We know inventory has been climbing all year. The northern cities have tight inventory and rising prices, some of the Sunbelt cities have the most inventory in many years, and some markets even have falling prices, too. Inventory is growing Lets start with supply. Inventory shrank every year for most of the decade.
The unsold inventory of homes on the market across the country is 28% greater than last year at this time. Withdrawals keep a lid on inventory growth. That suggests a shadow inventory of homes that want to be sold but the market isnt there for it. Inventory of unsold homes is climbing. This was a jump of 2.5%
This is measurable in both the total unsold inventory and the number of new listings each week. Because each week we have 815% more sellers than last year, the total inventory will continue to build unless and until demand shifts dramatically, which would require notably lower mortgage rates. Those do not seem imminent.
Weekly housing inventory continues upward Is inventory in the D.C This week’s inventory data gives us a vantage point into this weeks market dynamics. Inventory for single-family homes in the D.C ’s inventory level compared to 2024. Data and common sense show that federal job cuts are stressing D.C’s
Recently, weve shared that the inventory of unsold homes is growing. There are already plenty of markets nationwide where the inventory of unsold homes has built up over the past few years and home prices have ticked down. But by June, prices peaked for the year while remaining below the June 2022 peak.
at the beginning of 2022 and 30.5% For a number of factors, the proportion of newly constructed homes for sale has decreased from its peak, including: The market has seen an increase in existing inventory. The total supply of inventory of single-family homes is up 22% over the previous year. in Q2 of 2022. in Q1 of 2022.
It’s the end of May and unsold inventory on the market is increasing across the U.S. Every state in the country has more homes on the market now than a year ago and, in many places, new construction is being completed and added to inventory, so it’s not just resale inventory that’s growing. Higher rates create more inventory.
As high mortgage rates reshape the housing market, existing homes are making up a larger percentage of for-sale inventory, and homebuyers are taking notice. market share, while first-quarter 2022 saw a record high of 34.4%. The available inventory of existing homes rose by 22% year over year in Q3 2034. million units.
Altos Research tracks every home for sale in the country every week all the active inventory and pending sales as they happen as well as prices and supply and demand metrics Lets look at this weeks data. Inventory fell There are 635,000 single-family homes unsold on the market now. In 2018, mortgage rates and inventory rose all year.
Weekly housing inventory data Spring is upon us, and for me, the most compelling story in housing for 2024 and 2025 has been the inventory growth. Witnessing a solid week of inventory growth brings a smile to my face. Although we haven’t returned to normal levels yet, I appreciate our progress.
It’s still April, so there could be as many as eight more weeks of seller growth in the spring housing market. And seller growth is happening pretty much everywhere across the country, with Florida and Texas leading the way. The bearish take is that there are many more sellers than buyers and inventory is rising.
There’s a showdown at the housing market corral between homebuyers and sellers. It facilitated a very unhealthy housing market in 2020-2021 that became savage in 2022. Inventory, which has been falling for years, broke to all-time lows in 2020. Image by Brandon Johnson/HW Media.). million active listings, but at just 1.28
We finally have six weeks of numbers that hit my housing inventory growth model perfectly in 2024. Last year, with higher mortgage rates , we had zero weeks at this level so I am now giving 2024 inventory growth a grade of A. have higher inventory than the national data. I recently spoke about this in an interview on CNBC.
Inventory is past peak for the year, so the momentum looks to keep the trends in a positive direction for now. Inventory drops again There are 736,000 single-family homes unsold on the market in the U.S. The inventory peak came a month earlier than in 2023. Mortgage rates were super high and inventory was building.
Active weekly housing inventory growth slowed slightly last week, but it’s still running at a healthier clip than in 2023. I have a simple model with mortgage rates being above 7.25%: weekly inventory data should grow between 11,000-17,000 per week. We have now seen it for two weeks as inventory grew by 13,247. 2022: 19.2%
High mortgage rates, low inventory and sky-high prices resulted in historically low sales at a time when agents are already wrestling with the changes related to the $418 million antitrust settlement signed by the National Association of Realtors (NAR). In the current climate, homebuilders have advantages over existing-home sellers.
The numbers represent the slowest pace of new-home sales since November 2022, when the seasonally adjusted annual rate was 596,000. The post-pandemic low point occurred in July 2022, when the rate fell to 519,000. decline compared to September and a 9.4% decline year over year. The median sale price of a new home hit $437,300, a 4.7%
There have been a few markets; however, that have defied the national trends where inventory has stayed tighter and demand keeps rolling in. Available inventory of unsold homes in the U.S. Inventory rose just over 1% this week Available inventory of unsold single-family homes rose by just over 1% this week to 653,000.
Housing credit channels directly impact housing inventory channels. Home prices escalated out of control after 2020 and when we look at why that happened, we can see that housing credit mattered more to inventory data than most people realize. This matters because inventory was already heading toward all-time lows before COVID-19.
Going into 2023, people thought housing inventory would skyrocket, home prices would crash, and we would see the housing market of 2008 all over again. We created this weekly tracker at the end of 2022 to give people a live weekly outlook on everything that drives the housing market and which factors to follow.
On Friday NAR reported that total housing inventory levels broke under 1 million in December, dropping to 970,00 units for a population of 330 million people. And existing home sales crashed in 2022 from a peak of around 6.5 NAR Research Total housing inventory at the end of December was 970,000 units, down 13.4% months in Nov.
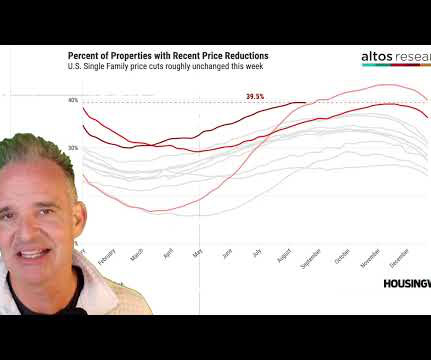
Last week, housing inventory grew and the number of price cuts fell, which is expected at this time of the year. I hope the next thing we see is housing inventory grow at the level it typically does in January or February instead of being delayed until March or April. So let’s hope for more home sellers in 2024.
The housing inventory shortage dominated much of the conversation surrounding the housing market in 2022, but thanks to softening homebuyer demand, the number of active listings finished the year up 54.7% Despite this sizable yearly increase, active housing inventory was down 33.4% compared to December 2019 and 38.2%
How will homebuyers and sellers react and how quickly can we measure it? Higher mortgage rates have forced available inventory to climb all year. Housing inventory There are now 526,000 single-family homes active unsold on the market. jump in unsold inventory in a week is very notable.
months’ worth of housing inventory in the U.S. In the chart below, with the red lines drawn, you can see how different the sales crash in 2022 was compared to the last two times rates rose and sales fell. million in March 2022). million in March 2022). Unsold inventory sits at a 2.6-month We only have 2.6
Unsold inventory of homes for sale has been on the rise all year. It hasn’t turned the corner yet — inventory rose across the country this week — but at less than 1% rate. There are some signs that inventory growth is slowing with newly lower mortgage rates and the end of the summer. There’s no sign of any big surge in sellers.
Data from Altos Research shows an area with expensive housing, rising inventory and conditions that lean favorable to sellers. LAs housing market has largely stabilized after the turbulence of the post-pandemic years and the rapid rise of mortgage rates beginning in 2022. The current median home price is $1.47 million, $3.9
The seasonal housing inventory bottom evaded us again last week as active listings fell and new listing inventory decreased. Here’s a quick rundown of the last week: Active inventory fell 5,383 last week, and new listing data is still trending at all-time lows in 2023. The answer is no!
The mortgage rate lockdown premise says that if rates rise, inventory can’t grow meaningfully. Let’s take a look at the inventory data this year to test this premise, since for many months it has been a working theory of mine that new listings data behavior last year marked a bottom and even going into 2024 we should see more sellers.
Total housing inventory growth has been slow in 2023, but with rising mortgage rates over the last few months, inventory has grown a bit faster than average. The question now is: Have we hit the seasonal peak in inventory for 2023? Last year, according to Altos Research , the seasonal peak for housing inventory was Oct.
We organize all of the trending information in your field so you don't have to. Join 9,000+ users and stay up to date on the latest articles your peers are reading.
You know about us, now we want to get to know you!
Let's personalize your content
Let's get even more personalized
We recognize your account from another site in our network, please click 'Send Email' below to continue with verifying your account and setting a password.


Let's personalize your content