This site uses cookies to improve your experience. To help us insure we adhere to various privacy regulations, please select your country/region of residence. If you do not select a country, we will assume you are from the United States. Select your Cookie Settings or view our Privacy Policy and Terms of Use.
Cookie Settings
Cookies and similar technologies are used on this website for proper function of the website, for tracking performance analytics and for marketing purposes. We and some of our third-party providers may use cookie data for various purposes. Please review the cookie settings below and choose your preference.
Used for the proper function of the website
Used for monitoring website traffic and interactions
Cookie Settings
Cookies and similar technologies are used on this website for proper function of the website, for tracking performance analytics and for marketing purposes. We and some of our third-party providers may use cookie data for various purposes. Please review the cookie settings below and choose your preference.
Strictly Necessary: Used for the proper function of the website
Performance/Analytics: Used for monitoring website traffic and interactions
Potential home sellers notice weak demand, fewer offers and price reductions, prompting them to back away from the market. If potential sellers avoid the market, this will keep a lid on supply growth. Newlistings are hitting the market Last year was an environment with 5% to 10% more sellers each week than a year prior.
The New Years week was expected to be slow, so it’s no surprise that newlistings and sales are down. The Christmas and New Year’s holidays fell on Wednesdays this year, which messes up two full weeks in terms of getting home sales done and tracking the numbers. Those will start rebounding in next weeks data.
Ive also highlighted 2018 when there were 775,000 single family homes on the market that February. Assuming mortgage rates stay higher for this year, well probably see that 2018 level again by next spring. Newlistings To get a lot of homes on the market though we need some sellers. Unsold newlistings amount to 4.8%
While we have 27% more homes for sale now than last year, we have 22% fewer homes on the market than at the end of 2018. Newlistings When we look at the sellers entering the market, there were 45,000 newlistings last week. We have a growing number of sellers each week compared to last year.
The rules of supply and demand economics always end up winning and weekly newlisting data is key. Newlisting data is growing year over year, but it will be the second-lowest newlisting data ever recorded in history. With more sellers who are buyers, we have a tad more demand this year.
There’s a showdown at the housing market corral between homebuyers and sellers. Mortgage rates went up to 5% in 2018 , cooling down the housing market but nothing too dramatic for the existing home sales market. Home prices ebb and flow, pricing was working in the sense that sellers met homebuyers to a degree.
Total home sales are outpacing newlistings by a wide margin every month, and real estate tech company Homesnap foresees the shortage continuing in 2021 unless more sellers enter the market. The divide between supply and demand is striking: compared to last year, total newlistings increased.22%,
According to recent Zillow data, as the home-buying season draws near, buyers are more affected by persistently high mortgage rates than sellers. Most purchasers in the market today have a high probability of seeing a price reduction on their bookmarked listing, even though competition varies significantly by region.
Fewer sellers see the upside of listing now Newlistings volume each week remains very low, and there are very few sellers who want or need to sell into this market. And there is certainly no flood of sellers. The data shows that 58,000 new single-family listings hit the market this week.
One month after the policy was implemented, the DOJ served NAR a second civil investigative demand (CID) , following the first CID it issued in 2018 over NARs now defunct Participation Rule. Miller believes that agents who push sellers to use private listing networks are not doing their fiduciary duty.
We saw this happen in 2013-2014 and 2018-2019. NAR total inventory data 1,250,000 One thing about purchase application data and demand is that a traditional seller is typically a buyer of a home. Newlisting data is down 5% year to date, as you can imagine. This means less demand for housing.
Two of my buyers just had their offers accepted because the sellers’ first buyers backed out. An improving supply situation may also be making a difference, with newlistings up 4% year over year — meaning more properties are hitting the market for buyers to bid on. million and 1.92
“These weeks boast many of the same benefits as the best week, but are just slightly less favorable due to falling newlisting activity.” A given week scored highly if it had more listings compared to other weeks of the year. Why This Particular Week? Each week was then ranked by the average of those scores.
Seasonal impacts are the norm with housing, and newlisting data is negative 6% year to date. We saw newlisting data decline when rates got to 6.25% the first time. A traditional seller is primarily a homebuyer, so not only do we lose the inventory for sale when this happens, but we also lose a buyer. months to 3.3
In the nearby metro area of Cape Coral-Fort Myers , active single-family inventory over the previous 90 days averaged 6,500 listings as of March 15, above its March 2020 level of 5,044 listings and approaching its March 2019 level of 7,243 listings. Smith attributes the uptick in inventory to a bump in newlistings.
We saw this in 2013-2014 and 2018-2019. In 2018, sales trends fell from 5.72 They have to move as well, so a traditional seller is a buyer most of the time when it’s a primary resident owner. The downside of rates moving up so quickly is that some sellers pull the plug until rates are better. Higher rates and sales data.
With mortgage rates briefly topping 8% and home prices breaking records throughout the year, many would-be sellers simply decided not to bother listing their homes, exacerbating already tight inventories. New data from the U.S. since the fourth quarter of 2018. How quickly would sellers return if rates were lower?
points on average, with a corresponding cost of about $1,500, in 2018 through 2020. “On While buyers seem to be returning to the market early in 2023, purchase loans locked in January are still off by 13% compared to the 2018 and 2019 pre-pandemic levels. points paid, Ben Graboske, president of Black Knight Data & Analytics, said.
Growing supply shortages are holding housing prices higher, and affordability constraints coupled with elevated rates lock potential sellers in place. 25, purchase lock counts were 21% below the same week in 2019, and 30% below the levels during the same week in 2018. As of the week ending Feb. Months of supply stagnated at about 3.1
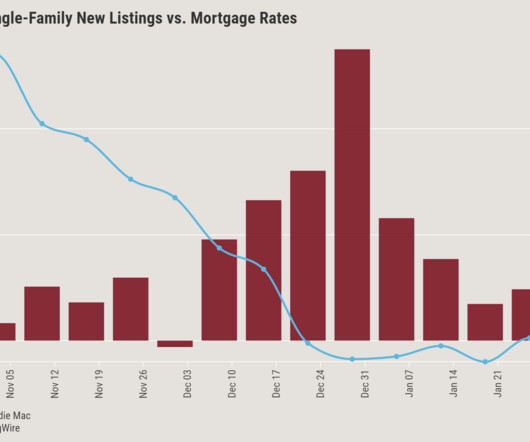
And should we be concerned if newlisting data doesn’t grow much this year? A great chart from Freddie Mac shows the trouble with having rates too high as newlisting data declines. One thing we have seen post COVID-19 that when newlisting data does decline, we can have a waterfall dive in demand.
If a year is a market slowdown, like 2022 or 2018, inventory might not peak until September or October. 450,000 is a psychological threshold for sellers and prices tend to cluster around these big numbers. The median price of the newlistings is $400,000 this week. Balanced between buyers and sellers.
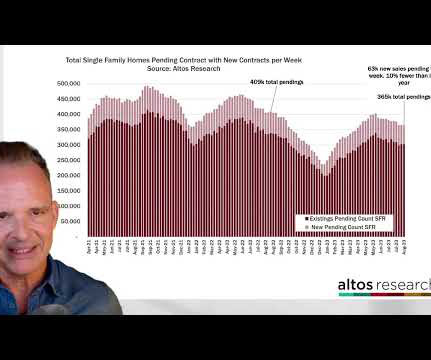
Sellers have not materialized, and buyers have been buying everything that becomes available. The peak of inventory for 2023 so far was the week of the New Year — that is insane. We could see inventory from distressed sellers emerge in 2025. I’ve been watching the price of the new pending sales each week. is $450,000.
Expired listing cold calling script Cold calling expired listings is a proven (if sometimes terrifying) way to find new business. These sellers were on the market with another agent before and could not sell. Usually, they’re inundated with agents calling them for the first few days after their listing expires.
We negotiated to get the sellers the highest price possible. Even if you’re months or even years away from moving, a seller’s prep session is one of the services I offer homeowners. Many of us are in sellers’ markets with very low inventory. The goal in prospecting FSBO sellers is to be that agent.
So if you want to actually generate leads from social media, focus on telling stories that resonate with local buyers and sellers. So get over your fear of being perfect and just start creating content that resonates with buyers and sellers in your farm area. Touring a newlisting? Take a quick sneak peek video.
Inventory often peaks the last week of August, the fall has fewer sellers and it keeps shrinking through the holidays. Early this year we had more home buyers than sellers, even with rates in the six-percent range. Price reductions are about to inch above 2018 and 2019 again. The price of the newly listed homes is 1.3%
Interestingly, the number of active listings has dropped every year since at least 2013. But it appears that we have hit the bottom when it comes to active listings. We can expect more listings in the future. Sellers are starting to realize that we are no longer in the same market as we were in 2020-2022.
Virtual open houses are a unique way to help you stand out from other agents as a tech-savvy marketer and can help get your listings in front of hundreds (possibly thousands) of potential buyers online. This increased exposure will help you find new leads, especially those impressed by your marketing skills.
The median price of the newlistings this week is $399,900. As the summer progresses, each subsequent week of newlistings gets priced at a slight discount to the previous weeks. Mortgage rates rose during 2018 which tempered demand. Sellers are in much better shape than they were last year.
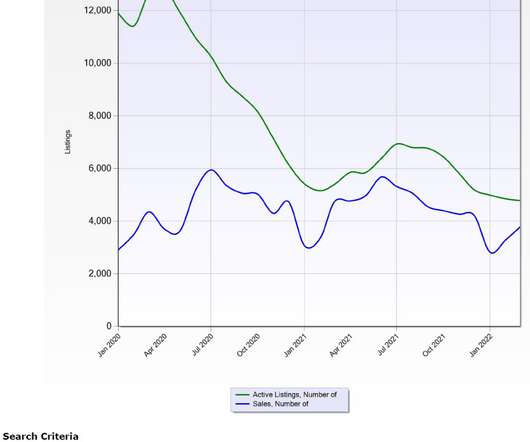
Traditionally, the months of May and June see the most newlistings as the school cycle hits – graduating families sell and rising families buy. The charts below focus on key indicators; number of listings, number of sales, days on market and sale to list ratio. consider this a broad overview.
Buyer demand has dropped due to rising rates, and seller supply slowed too, creating an uneasy balance. But if buyers drop or sellers expand more, it will impact prices. NEW YORK – The U.S. The trend line will start to look concerning if it breaks through seasonal norms from 2018 and 2019 in the months ahead.
To get a real price crash, we would need to see a surge of housing inventory and distressed sellers. Where I disagree with Yun is this: We have more inventory because demand has been softer, and we have more newlistings this year compared to last. from August to a seasonally adjusted annual rate of 3.84 million in September.
The region’s real estate scene in 2023 will be remembered for rising home prices and scant newlistings. Buyers and sellers tiptoed through caution. As the year dims, all eyes fixate on 2024’s potential: a hopeful dance fueled by dreams of lower rates and a wave of new homes for sale. Um, bye-bye!
Unless the listed home is in a favorable location, priced competitively and move-in ready, activity has been somewhat muted as prospective buyers and sellers wait for economic conditions to improve. Sellers who priced their homes appropriately enjoyed busy open houses in their first weekend on the market followed by multiple offers.
The number of newlistings for all home types – single-family, townhomes and condos combined – in King (887) fell 47% from November and declined 36% from December 2021. If there is promising news, it’s that winter housing statistics are usually stark amid a lack of activity and few newlistings. news publishers.
Home sellers should focus on their local market and pull out all the stops when listing a house. 2022 Market Trends: Decrease in sales, values, and newlistings in Austin, TX; median home value up 9.9% AirBnB prices will likely drop and vacancies will increase. Episode Highlights. That’s a staggeringly high number.”
Beyond labor strife, America’s home buyers and sellers appear to be on strike as well. October figures from the Northwest Multiple Listing Service strongly suggest prospective buyers and sellers are taking a wait-and-see approach. Newlistings in King were off 26% month-to-month (1583) and Active listings were down 9.4% (2296).
To be sure, the market is still leaning heavily in the sellers’ favor and listings are slimmer than a strand of spaghetti. Newlistings are up 6.3% Condo sales are in a similar boat, with newlistings higher – by 4.3% Purchased in 2018 for $2.64M, the owner is seeking $4.99M, $1640/sq. 1 vs. Sept.
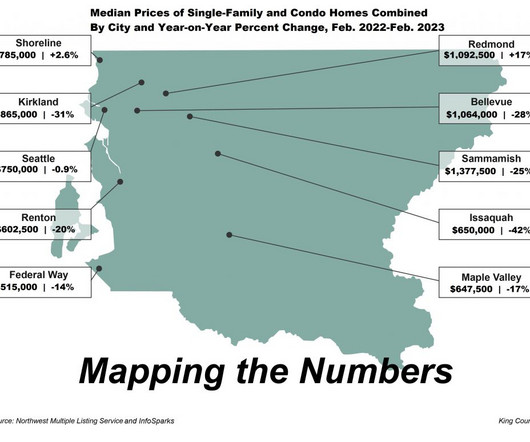
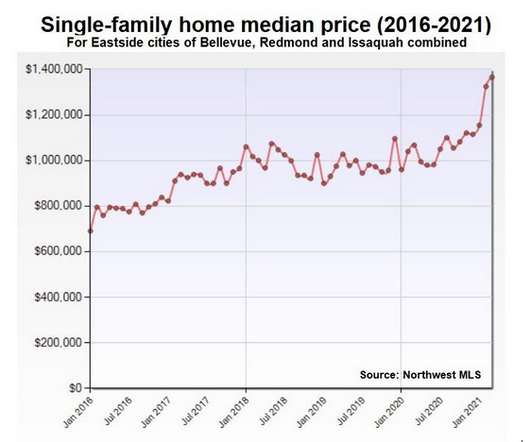
increase to $1.1M, according to the Northwest Multiple Listing Service (chart). Buyers and sellers across King County may answer with an Oh, yeah! by looking at Januarys Northwest Multiple Listing Service report. Sellers got a head start on spring by introducing more than double the number of homes for sale in December.
Here’s the key difference between now and 2008-2010: Homeowners have record levels of equity and should be able to tap into that to sell their homes – probably for a profit in this sellers’ market – and avoid foreclosure. The image was taken from a drone above The Parc, a condo in Belltown, where I am promoting one of my newlistings.
Here’s a negotiating tactic that you may not have thought of: Sellers who “spy” on buyers when they are visiting the home. About three in every 10 sellers say they have used a camera on the property during an open house or showing at their home, according to a study of more than 2,000 consumers from LendingTree. SMILE FOR THE CAMERA.
HB 1951 would remove “Don’t Know” from the Seller Disclosure Statement that owners complete with the sale of a home. The survey also said that among sellers in the 12 months ending mid-2021, 46% went on to purchase a larger home. >> The U.S. rental-vacancy rate dropped to 5.8% For our housing market, it’s time to have that talk.
An independent estimate from 2018 claims roughly 40% of the nation is in a flood-risk area. The market recalibration continues across King County with a sharp drop in newlistings, Pending sales and closings while prices decline. The number of new homes for sale fell 19% (4009) across the county from June to July and 9.5%
That’s 52% higher than 2018, when Freddie first began looking at housing shortages. The county saw newlistings and end-month Active listings rise but Pending sales slip, suggesting buyers are no longer snatching every listing on the Northwest MLS as they become available. Listed at $1,995,000 ($725/sq.
We organize all of the trending information in your field so you don't have to. Join 9,000+ users and stay up to date on the latest articles your peers are reading.
You know about us, now we want to get to know you!
Let's personalize your content
Let's get even more personalized
We recognize your account from another site in our network, please click 'Send Email' below to continue with verifying your account and setting a password.


Let's personalize your content