This site uses cookies to improve your experience. To help us insure we adhere to various privacy regulations, please select your country/region of residence. If you do not select a country, we will assume you are from the United States. Select your Cookie Settings or view our Privacy Policy and Terms of Use.
Cookie Settings
Cookies and similar technologies are used on this website for proper function of the website, for tracking performance analytics and for marketing purposes. We and some of our third-party providers may use cookie data for various purposes. Please review the cookie settings below and choose your preference.
Used for the proper function of the website
Used for monitoring website traffic and interactions
Cookie Settings
Cookies and similar technologies are used on this website for proper function of the website, for tracking performance analytics and for marketing purposes. We and some of our third-party providers may use cookie data for various purposes. Please review the cookie settings below and choose your preference.
Strictly Necessary: Used for the proper function of the website
Performance/Analytics: Used for monitoring website traffic and interactions
One reason that home prices have stayed elevated is that inventory nationally is still restricted. But if current trends continue, the inventory shortage will be effectively gone by next spring. In fact, while home prices are higher than a year ago, inventory has increased at the rate price appreciation has decreased.
As the year draws to a close, available unsold inventory of homes on the market is nearly 27% greater than a year ago. Ten states have more inventory unsold than in 2019, which was the last sort of normal year before the pandemic. Inventory is still very tight in places like Chicago and New England, but it is rising in these markets.
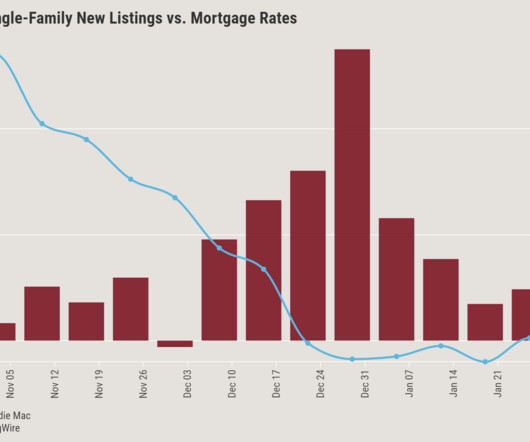
Potential home sellers notice weak demand, fewer offers and price reductions, prompting them to back away from the market. As such, housing inventory isn’t shrinking. If potential sellers avoid the market, this will keep a lid on supply growth. This week, the new listings stat has grown with slightly more sellers.
Altos Research tracks every home for sale in the country every week all the active inventory and pending sales as they happen as well as prices and supply and demand metrics Lets look at this weeks data. Inventory fell There are 635,000 single-family homes unsold on the market now. In 2018, mortgage rates and inventory rose all year.
in July from a year ago, the biggest advance since 2018, as rock-bottom mortgage rates made it possible for people to bid higher for properties. advance in the prior month, and it was the largest annual gain since December 2018. The post Home-price index gains the most since 2018 appeared first on HousingWire.
There’s a showdown at the housing market corral between homebuyers and sellers. Inventory, which has been falling for years, broke to all-time lows in 2020. We didn’t have a seasonal push in inventory in 2020, and things worsened in 2021. Image by Brandon Johnson/HW Media.). million active listings, but at just 1.28
Even prior to the pandemic , housing inventory had hit record lows, and the problem has only gotten worse as demand continues to rise. Total home sales are outpacing new listings by a wide margin every month, and real estate tech company Homesnap foresees the shortage continuing in 2021 unless more sellers enter the market.
It’s an excellent time to discuss housing inventory. How can housing inventory be so low today when it skyrocketed back in 2009? If you follow the trend of housing supply since 2014, it’s been falling every year — with a pause in 2018-2019 — and then collapsed lower post-2020. I don’t believe housing inventory below 1.52
Given the current housing inventory crisis, it might surprise people to realize this: we built too many homes during the housing bubble years. Yes, but this is where my work is much different from other housing economists and why we need to think of inventory in a new, modern 21st-century mindset. Wait, what?
The relative pressure of supply vs. demand in the housing market is gauged by the level of active inventory. Like dropping barometric pressure, plunging inventory usually foretells stormy conditions: Faster price growth and faster sales. But the market is so overheated right now that it will take some time to achieve this balance.
With mortgage rates briefly topping 8% and home prices breaking records throughout the year, many would-be sellers simply decided not to bother listing their homes, exacerbating already tight inventories. This squeezed inventory even further throughout 2022 and 2023, pushing home prices to record highs month after month.
The National Association of Realtors (NAR) reported today on two trends in existing home sales that we have seen for many months now: sales are declining while total inventory data has fallen directly for the three straight months. Total housing inventory fell in this report, the third report in a row that shows total inventory has decreased.
Despite mortgage rates briefly falling below the 6% threshold, both housing inventory and mortgage demand fell last week. Weekly Housing Inventory A few weeks ago, I was encouraged that we had a slight increase in inventory and a small decline the following week. This week inventory fell 8,664 units from the previous week.
Given the current housing inventory crisis, it might surprise people to realize this: we built too many homes during the housing bubble years. Yes, but this is where my work is much different from other housing economists and why we need to think of inventory in a new, modern 21st-century mindset. Wait, what?
For-sale inventory continues to recover, but is still 25% below pre-pandemic norms. annually, which is somewhat less than the mid-3% rise observed in 2018 and 2019, while detached home rents are up 4.4%, which is comparable to their trajectory prior to the pandemic. In the meantime, owned home value growth has leveled out at 2.6%
Unlike many other metropolitan areas across the country , the housing market in Southwest Florida is comparably flush with for-sale inventory. “I We are seeing a healthy increase in inventory, which we really needed.” Smith attributes the uptick in inventory to a bump in new listings. From 2022 to 2023 alone, rates rose 15%.
Buyers in this real estate market notice these affordability changes, and so we can see in the data fewer home purchase offers, slightly climbing unsold inventory, and slightly more price reductions for the homes that are on the market. Rising rates make more inventory. So how much inventory will we add this fall?
As we approach the end of another hot year for the market, homebuyers and sellers are eagerly looking ahead to the 2022 housing market. In a normal market, we tend to see about 30% to 35% of sellers initially over-price their homes and eventually reduce the price to attract buyers. Low inventory will continue to be a major issue.
Inventory continues to grow faster than last year at this time. Higher rates equal more inventory, and lower rates equal less inventory. If mortgage rates were to fall between now and January, expect to see inventory decline again next year like it did for most of this year. And there is certainly no flood of sellers.
Lack of inventory is an issue builders and mortgage loan originators alike are dealing with across the nation. The inventory put a cap on how much business Marquis’ team can do, which is one of the reasons why Marquis is now licensed in 22 states. In our market here in Boston, we have incredibly low inventory.
Second, because of the downtrend in inventory since 2014 and the demand pick-up we will see in the years 2020-2024, we had a risk of home prices accelerating too much. As you can see below, the new home sales market from 2018-2022 doesn’t look like the housing market we had from 2002-2005. First, total home sales should be 6.2
Pent-up demand caused the housing market to flare up in February, but as buyers wait for more inventory, it has cooled off in March, according to Josh Felder, a Redfin Premier real estate agent in the Bay Area. Many home sellers overprice their properties and wind up receiving less money than they had anticipated. ppts 42.7%
The bidding wars that put smiles on the faces of sellers and simultaneously drove buyers to rip their hair out weren’t as frequent in August, according to the latest report from brokerage Redfin. The report attributes this decrease to the normal seasonal slowdown, causing the shortage of inventory to slow as well. million and 1.92
Two of my buyers just had their offers accepted because the sellers’ first buyers backed out. In 2018-2019, total housing inventory was in the range between 1.52 million, and that level of inventory helped to drive real home-price growth in 2019 into negative territory briefly. million and 1.92 million to 5.61
Housing inventory is growing, but national home prices aren’t dropping dramatically, as the recent S&P CoreLogic Case Shiller index clearly showed. Today, we will examine new listing data more extensively to provide a clear example of a stressed seller market and compare that to where we are today.
The home-price growth from 2020 through 2022 has been so unhealthy that I’ve labeled this a savagely unhealthy housing market as inventory has once again collapsed on a year-over-year basis in 2022. Inventory is still showing negative year-over-year data. 2014 was the very last year total housing inventory grew in America.
But, there is one bright spot — inventory is rising. This has been a concern of mine after the summer of 2020 as inventory levels were breaking all-time lows, facilitating unhealthy home price growth during a more prominent demographic patch in U.S. The one positive: Inventory is rising. Once total inventory levels reach 1.52-1.93
“During the course of the pandemic, ‘home’ had become more important than ever, and as a result, strong purchase demand continues—but buyers also outnumber the sellers,” Khater said. Sales of existing homes fell 6.6% in February to a seasonally adjusted annual rate of 6.22 month-over-month.
Inventory levels broke to all-time lows and thus created massive housing inflation quickly, which broke my model. We saw this happen in 2013-2014 and 2018-2019. The glaring difference between now and 2014 is that total inventory levels are roughly 1 million lower now than the peak of 2014. nominal per year at most.
Realtor.com’s Sixth Annual “ Best Time to Buy Report ” examined listing prices, inventory levels, new “fresh” listings, time on market, homebuyer demand, and price reductions, revealing that the “Best Time to Buy” in 2024 will be the week of September 29-October 5. According to Zillow , the average U.S. home value is presently $362,481, up 3.3%
Growing supply shortages are holding housing prices higher, and affordability constraints coupled with elevated rates lock potential sellers in place. The three-pronged challenge of inventory shortages, unaffordable housing and rising interest rates kept home prices more moderate, as supply can’t match demand, the report said.
Housing affordability and limited inventory impacted the buying power of all buyers, however, the greatest impact was felt by Black and Asian Americans, as both groups saw a shrinking share of home buyers,” Jessica Lautz, NAR’s vice president of demographics and behavioral insights, said in a statement.
Between 2018 and 2023, homeowners insurance rates in Louisiana jumped 24.9%, according to an analysis by S&P Global. Altos classifies scores above 30 to be indicative of a sellers’ market. Prices are still higher than they were previously, but at least in my area, sellers are working with buyers.”
We saw this in 2013-2014 and 2018-2019. In 2018, sales trends fell from 5.72 They have to move as well, so a traditional seller is a buyer most of the time when it’s a primary resident owner. The downside of rates moving up so quickly is that some sellers pull the plug until rates are better. NAR total inventory data.
Looking at the housing market in the years 2020-2024, one risk i identified early on was that home prices could accelerate more in this period than we saw in the previous expansion if inventory channels broke to all-time lows. Back then, we had higher sales, higher inventory, and less price growth, but we had a massive credit bubble.
A few months ago, I was asked to go on CNBC and talk about why I call this a housing recession and why this year reminds me a lot of 2018, but much worse on the four items above. Part of the issue is that mortgage rates moved up so fast that many sellers quit this year as well. Housing inventory. million in 2005.
On the supply side, the market continues to improve with an increasing number of properties being listed on the market as more sellers begin to accept the new normal.” And last month’s level of unsold inventory was up 23.8% From 2018 through 2023, effective rates jumped by 33.8% to $854,490. compared to February 2024.
Sellers are increasingly cutting prices to entice buyers struggling with affordability,” said Dr. Skylar Olsen, Chief Economist for Zillow. While inventory levels are still about 33% below pre-pandemic averages, that’s the smallest deficit since the fall of 2020, when the pool of available homes was quickly dropping. The post U.S.
points on average, with a corresponding cost of about $1,500, in 2018 through 2020. “On While buyers seem to be returning to the market early in 2023, purchase loans locked in January are still off by 13% compared to the 2018 and 2019 pre-pandemic levels. points paid, Ben Graboske, president of Black Knight Data & Analytics, said.
Seattle is currently a hot market – in October, there was less than a month’s worth of inventory and pending home sales outpaced supply. Since 2018, Redfin has also offered its Concierge listing service in both markets, for a listing fee as low as 2%. Presented by: Fannie Mae.
Inventory There are now 479,000 single-family homes on the market across the U.S. Each year, housing inventory typically peaks in the third quarter. If a year is a market slowdown, like 2022 or 2018, inventory might not peak until September or October. Our estimation is that inventory could peak as early as next week.
By October 2022, it looked like 2023 would have rising inventory and falling home prices. Sellers have not materialized, and buyers have been buying everything that becomes available. Inventory has fallen all year. The peak of inventory for 2023 so far was the week of the New Year — that is insane. is $450,000.
I know some people don’t agree with me on this, but the price gains in both the existing home and new home sales sector show that homebuilders and sellers had too much pricing power and needed to be checked. My biggest thing is getting total inventory back to 2018-2019 levels, which can range from 1.52-1.93 This is 16.6
percent, the first time the FOMC has changed the federal funds rate in two years, and the first rate hike since March 2018. And that market is largely defined by a dearth of inventory. It was the fifth consecutive drop in inventory. The FOMC, as was predicted, raised the federal funds rate by 25 basis points to 0.25-0.50
We organize all of the trending information in your field so you don't have to. Join 9,000+ users and stay up to date on the latest articles your peers are reading.
You know about us, now we want to get to know you!
Let's personalize your content
Let's get even more personalized
We recognize your account from another site in our network, please click 'Send Email' below to continue with verifying your account and setting a password.


Let's personalize your content