This site uses cookies to improve your experience. To help us insure we adhere to various privacy regulations, please select your country/region of residence. If you do not select a country, we will assume you are from the United States. Select your Cookie Settings or view our Privacy Policy and Terms of Use.
Cookie Settings
Cookies and similar technologies are used on this website for proper function of the website, for tracking performance analytics and for marketing purposes. We and some of our third-party providers may use cookie data for various purposes. Please review the cookie settings below and choose your preference.
Used for the proper function of the website
Used for monitoring website traffic and interactions
Cookie Settings
Cookies and similar technologies are used on this website for proper function of the website, for tracking performance analytics and for marketing purposes. We and some of our third-party providers may use cookie data for various purposes. Please review the cookie settings below and choose your preference.
Strictly Necessary: Used for the proper function of the website
Performance/Analytics: Used for monitoring website traffic and interactions
One reason that home prices have stayed elevated is that inventory nationally is still restricted. But if current trends continue, the inventory shortage will be effectively gone by next spring. In fact, while home prices are higher than a year ago, inventory has increased at the rate price appreciation has decreased.
As the year draws to a close, available unsold inventory of homes on the market is nearly 27% greater than a year ago. Ten states have more inventory unsold than in 2019, which was the last sort of normal year before the pandemic. Inventory is still very tight in places like Chicago and New England, but it is rising in these markets.
The New Years week was expected to be slow, so it’s no surprise that newlistings and sales are down. The Christmas and New Year’s holidays fell on Wednesdays this year, which messes up two full weeks in terms of getting home sales done and tracking the numbers. Those will start rebounding in next weeks data.
As such, housing inventory isn’t shrinking. Newlistings are hitting the market Last year was an environment with 5% to 10% more sellers each week than a year prior. This week, the newlistings stat has grown with slightly more sellers. Any inventory growth now is because demand is really weak.
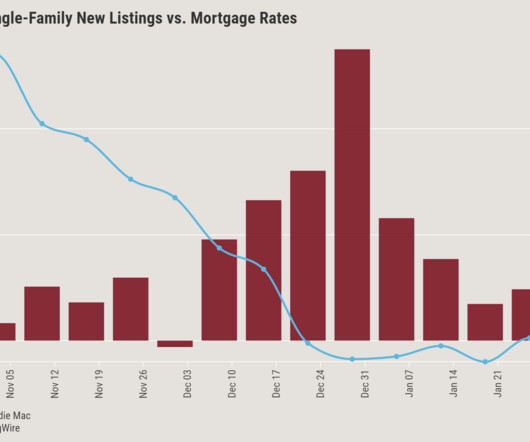
What’s going on with housing inventory ? The last four weeks of newlistings data have been the most volatile since mortgage rates breached 6% in 2022. One week, we had the biggest decline in newlistings data all year, which might indicate Americans are giving up on listing their homes.
Even prior to the pandemic , housing inventory had hit record lows, and the problem has only gotten worse as demand continues to rise. Total home sales are outpacing newlistings by a wide margin every month, and real estate tech company Homesnap foresees the shortage continuing in 2021 unless more sellers enter the market.
Housing inventory is growing, but national home prices aren’t dropping dramatically, as the recent S&P CoreLogic Case Shiller index clearly showed. The rules of supply and demand economics always end up winning and weekly newlisting data is key. Last week, we saw a positive inventory growth of 11,638 !
The housing market faced some serious obstacles last week as the 10-year yield broke over 4%, mortgage rates rose to over 7%, purchase apps fell again and we are still trying to find the elusive seasonal bottom for housing inventory. I discussed my theory on why inventory bottoms out later in the year on this HousingWire Daily podcast.
The National Association of Realtors (NAR) reported today on two trends in existing home sales that we have seen for many months now: sales are declining while total inventory data has fallen directly for the three straight months. Total housing inventory fell in this report, the third report in a row that shows total inventory has decreased.
Despite mortgage rates briefly falling below the 6% threshold, both housing inventory and mortgage demand fell last week. Weekly Housing Inventory A few weeks ago, I was encouraged that we had a slight increase in inventory and a small decline the following week. This week inventory fell 8,664 units from the previous week.
Notably, while the flow of newlistings to the market is still nearly 14% lower than it was before the COVID-19 pandemic, its much improved to compared to the deficit of 25% in March 2024. For-sale inventory is now about 26% below the norms of 2018 and 2019, the smallest shortfall since September 2020.
With mortgage rates briefly topping 8% and home prices breaking records throughout the year, many would-be sellers simply decided not to bother listing their homes, exacerbating already tight inventories. New data from the U.S. When inventory bounces back The extremes of the 2020s have dealt big blows to for-sale inventories.
Unlike many other metropolitan areas across the country , the housing market in Southwest Florida is comparably flush with for-sale inventory. “I We are seeing a healthy increase in inventory, which we really needed.” Smith attributes the uptick in inventory to a bump in newlistings.
More expensive money also meant fewer investors holding homes so inventory would climb too. The price of newlistings continues to rise, which is a very bullish indicator for sales prices in the coming months. Fortunately we have 2018 as a guide to understand the impact of rising interest rates on the housing market in 2022.
On housing inventory , newlistings data saw a small decline last week, but active listings grew at a healthy clip. We have had some volatile weekly numbers in the newlistings data recently, but even with the mortgage rate spike, the decline was orderly, as it has been all year.
Inventory, which has been falling for years, broke to all-time lows in 2020. We didn’t have a seasonal push in inventory in 2020, and things worsened in 2021. Of course, this has brought back some inventory, as demand weakness always creates inventory through accumulation. million active listings, but at just 1.28
Buyers in this real estate market notice these affordability changes, and so we can see in the data fewer home purchase offers, slightly climbing unsold inventory, and slightly more price reductions for the homes that are on the market. Rising rates make more inventory. So how much inventory will we add this fall?
history, and because of that, not even low inventory could prevent home prices from declining month to month in the second half of 2022. Now we can talk about the final stage: inventory in the U.S. Housing inventory The No. Housing inventory The No. This also means there will be no bubble crash in prices in 2023.
Inventory levels broke to all-time lows and thus created massive housing inflation quickly, which broke my model. We saw this happen in 2013-2014 and 2018-2019. The glaring difference between now and 2014 is that total inventory levels are roughly 1 million lower now than the peak of 2014. nominal per year at most.
Inventory continues to grow faster than last year at this time. Higher rates equal more inventory, and lower rates equal less inventory. If mortgage rates were to fall between now and January, expect to see inventory decline again next year like it did for most of this year. That’s up a fraction from last week.
An improving supply situation may also be making a difference, with newlistings up 4% year over year — meaning more properties are hitting the market for buyers to bid on. In 2018-2019, total housing inventory was in the range between 1.52 million and 1.92 million to 5.61
Newlistings are also up 4% year over year, meaning more properties are hitting the housing market for buyers to bid on. In 2018-2019, total housing market inventory was in the range between 1.52 million, and that level of inventory helped to drive real home-price growth in 2019 into negative territory briefly.
Realtor.com’s Sixth Annual “ Best Time to Buy Report ” examined listing prices, inventory levels, new “fresh” listings, time on market, homebuyer demand, and price reductions, revealing that the “Best Time to Buy” in 2024 will be the week of September 29-October 5. According to Zillow , the average U.S.
Declining mortgage rates could have improved affordability for buyers in the housing market in February, but instead spurred a demand that, combined with a persistent lack of inventory across the U.S., “In many areas of the country, that dynamic – low inventory and a modest rise in demand – led to an uptick in home prices.”
Weekly inventory fell by 6201 , and newlisting data is down noticeably from last year, which was different than last week. The 10-year yield, already at a key critical level, couldn’t break higher but reversed and went lower Friday after the jobs report and the news around Silicon Valley Bank. million in 2023.
Price impacts could strengthen again if 30-year rates continue to climb, as they have through late February, although tight inventory will put a floor on how much prices will ease, the report noted. 25, purchase lock counts were 21% below the same week in 2019, and 30% below the levels during the same week in 2018.
points on average, with a corresponding cost of about $1,500, in 2018 through 2020. “On While buyers seem to be returning to the market early in 2023, purchase loans locked in January are still off by 13% compared to the 2018 and 2019 pre-pandemic levels. points paid, Ben Graboske, president of Black Knight Data & Analytics, said.
Inventory There are now 479,000 single-family homes on the market across the U.S. Each year, housing inventory typically peaks in the third quarter. If a year is a market slowdown, like 2022 or 2018, inventory might not peak until September or October. Our estimation is that inventory could peak as early as next week.
We saw this in 2013-2014 and 2018-2019. In 2018, sales trends fell from 5.72 We see some of this in the active listing data as newlistings are declining. Lower rates may pull some of these listings forward as people feel more comfortable with rates down; time will tell. NAR total inventory data.
By October 2022, it looked like 2023 would have rising inventory and falling home prices. Inventory has fallen all year. The peak of inventory for 2023 so far was the week of the New Year — that is insane. We could see inventory from distressed sellers emerge in 2025. I grew pretty bearish again. is $450,000.
The median price of the newlistings this week is $399,900. As the summer progresses, each subsequent week of newlistings gets priced at a slight discount to the previous weeks. Inventory As a result, the seasonal inventory build is slow and on a normal cycle. Home prices declined subsequently.
Newlistings dropped 23 percent year over year, pulling the number of homes on the market down 39 percent compared to the same period five years ago, according to an analysis by Redfin issued Thursday.
Even with the long-anticipated break in for-sale inventory, the surging cost of homeownership, further fueled by rising insurance and tax expenses, is holding potential home sales back, as is evident in the slow rise in sales compared with last year. Rapid market slowdowns, however, need to be seen in a larger perspective.
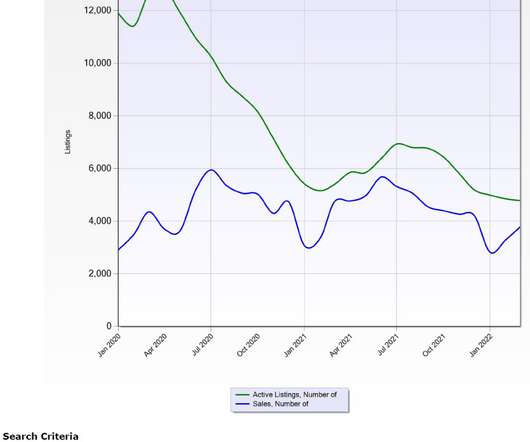
While we still have a significant shortage of housing inventory in Cuyahoga County, we had more active listings last month than we had in December 2020 and 2021. The chart below reflects the total active single-family listings in Cuyahoga County. Something else to watch is housing inventory.
ResiClub analyzed September inventory data just released from Realtor.com. Lance Lambert Source: [link] When assessing home price momentum, ResiClub believes it’s important to monitor active listings and months of supply. Conversely, a rapid decline in active listings could suggest a market that is heating up.
The goal of this type of letter is to promote a newlisting in the neighborhood, to position yourself as the expert by providing information about the listing, and to find more business. Many of us are in sellers’ markets with very low inventory. Inventory is extremely low, and the competition is fierce.
It's time to answer the nagging question…did housing inventory in Atlanta increase during the first quarter of 2022? Traditionally, the months of May and June see the most newlistings as the school cycle hits – graduating families sell and rising families buy. The difference now is rising rates and even less inventory.
year over year from March 2018. After estimating in late 2018 that 30-year mortgage rates could reach 5.1% This will be a relief for aspiring buyers burdened by dwindling inventory, high prices, and competition, particularly in hot markets like the Bay Area and Greater Boston. Index Points in April of 2019.
year over year from March 2018. After estimating in late 2018 that 30-year mortgage rates could reach 5.1% This will be a relief for aspiring buyers burdened by dwindling inventory, high prices, and competition, particularly in hot markets like the Bay Area and Greater Boston. Index Points in April of 2019.
The start of the year, of course, is when homeowners and real estate agents start to bring newinventory to market. As the thinking goes, buyers and sellers often want to get their transactions closed by summer, especially if they have children starting at new schools in September. It would take just 3.3
To get a real price crash, we would need to see a surge of housing inventory and distressed sellers. As you will see below, inventory is growing, but it’s been a calm, healthy rise in 2024, not a flood of houses coming onto the market. Using the NAR data, the normal amount of active inventory since 1982 has been between 2 and 2.5
The number of newlistings for all home types – single-family, townhomes and condos combined – in King (887) fell 47% from November and declined 36% from December 2021. The general softening of prices comes despite tight inventory, even when factoring out canceled and expired listings that typically take place in November and December.
2022 Market Trends: Decrease in sales, values, and newlistings in Austin, TX; median home value up 9.9% New Construction: Slowing down due to an increase in inventory and a declining market; builders targeting first-time home buyers. ” [0:19:31] Builders Offer Incentives to Move Inventory in Slump Market.
The region’s real estate scene in 2023 will be remembered for rising home prices and scant newlistings. As the year dims, all eyes fixate on 2024’s potential: a hopeful dance fueled by dreams of lower rates and a wave of new homes for sale. Buyers and sellers tiptoed through caution.
We organize all of the trending information in your field so you don't have to. Join 9,000+ users and stay up to date on the latest articles your peers are reading.
You know about us, now we want to get to know you!
Let's personalize your content
Let's get even more personalized
We recognize your account from another site in our network, please click 'Send Email' below to continue with verifying your account and setting a password.


Let's personalize your content