This site uses cookies to improve your experience. To help us insure we adhere to various privacy regulations, please select your country/region of residence. If you do not select a country, we will assume you are from the United States. Select your Cookie Settings or view our Privacy Policy and Terms of Use.
Cookie Settings
Cookies and similar technologies are used on this website for proper function of the website, for tracking performance analytics and for marketing purposes. We and some of our third-party providers may use cookie data for various purposes. Please review the cookie settings below and choose your preference.
Used for the proper function of the website
Used for monitoring website traffic and interactions
Cookie Settings
Cookies and similar technologies are used on this website for proper function of the website, for tracking performance analytics and for marketing purposes. We and some of our third-party providers may use cookie data for various purposes. Please review the cookie settings below and choose your preference.
Strictly Necessary: Used for the proper function of the website
Performance/Analytics: Used for monitoring website traffic and interactions
Let’s look specifically at the current market data compared to 2011. Why choose 2011? The housing bubble crash years of 2008-2011 saw a surge in foreclosures due to the lack of selling equity and this also profoundly impacted housing demand. Last week in 2011, 396,955 homes hit the market without a contract.
The rules of supply and demand economics always end up winning and weekly newlisting data is key. Newlisting data is growing year over year, but it will be the second-lowest newlisting data ever recorded in history. For the fifth time this year, inventory hit my target level with elevated mortgage rates.
Since I believe most home sellers are also homebuyers, once newlistings created a new low level after mortgage rates reached over 6% in 2022, it added another layer of home demand falling off a cliff. What we want to see in 2024 is newlisting data growing in the spring season. Weekly inventory change (Dec.
Here’s a quick rundown of the last week: Active listings rose by 8,546 , and newlisting data showed some growth. If that is the case, then this week’s gain in active inventory and newlistings needs to be taken with a grain of salt until we get next week’s data. However, I will take what I can now.
Imagine a housing market with just 6% mortgage rates or lower — it would be growing like what we see in the new home sales market. The growth isn’t just in active inventory but also newlistings. Weekly housing inventory data The best housing story for 2024 so far is that inventory is growing yearly.
The one period where this didn’t happen was from 2006-2011, when credit forced Americans to sell, to rent or to be homeless. During that period, we saw newlisting data decline. Total housing costs for American homeowners versus their wages are meager, and most will buy a home right away when they sell.
Weekly newlisting data for the last week over several previous years: 2024: 59,243 2023: 50,687 2022: 59,661 For some historical context, newlisting data this week in 2011 was 362,248. However, growth is growth, and if we can match spring 2022 and 2021 levels, I will be a happy camper.
This explains why total active listing inventory data has been stable over the decades, with the exception of 2006-2011, when those forced distressed credit home sellers couldn’t buy. Mortgage rates spiked in March, and then the newlisting data started to decline at the end of June.
17-24), Inventory fell from 437,282 to 430,395 The recent inventory bottom was in 2022 at 240,194 The inventory peak for 2023 was 569,898 For context, active listings for this week in 2015 were 958,304 Newlistings data Newlistings data is growing year over year and increasing week to week, but I wish we were seeing more significant growth.
If I am wrong and mortgage rates go lower for longer and we don’t get more newlistings in 2024, then home prices can grow faster in 2024 because we will have the same issue as before: too many people chasing too few homes. We haven’t had newlistings data break over 90,000 in the peak seasons of 2021, 2022 or 2023.
Existing home sales have more legs to go lower, especially now that newlisting data is falling. A traditional primary resident seller is also a buyer, which means if they don’t list, they’re not just taking a potential home to be bought off the table — they’re taking a future sale off the books as well. million in August.”
To give you all some perspective, this data line dropped all the way to 14 days in the crazy period of COVID-19, while back in 2011, it was 105 days. In the CNBC interview, I stressed that we do have one positive on the inventory side of things: we are seeing newlistings data growth.
I don’t need to see total active listing get back to the historical range of 2-2.5 Newlistings are declining now. Inventory is always seasonal, but the decline in newlistings this year was not what I wanted to see. This is not encouraging news at all, in my view. From Redfin.
But, the really painful trend is newlistings data. Newlistings data is trending at the lowest levels ever recorded in U.S. Last week there were only 62,000 newlistings that came to the market. Back in 2011, it was 101 days. That took another downfall toward the middle part of last year.
If we are trending below 4 million — a possibility with newlisting data trending at all-time lows — then we have much weaker demand than people think. This is the reality of our world: total active listings are still near all-time lows and demand so far has been stable since Nov. Now if we get a few sales prints above 4.6
Home purchase sentiment hit its lowest level since 2011 and home builder sentiment fell for the 10th consecutive month in September as construction activity slowed. Sellers are responding to the shift in the market and pulling back on listing activity, resulting in a 9.8%
I have been forecasting since 2010 and I’ve only predicted price declines for 2011 and 2012. However, weeks after that call, the newlisting data started to decline noticeably, which makes that call much harder to happen in 2023. The higher the rate from this level, the more significant hit to affordability we will see.
Only from 2006-2011 did we see this break due to forced sellers who couldn’t buy homes. One issue that has created a waterfall dive in purchase application data and sales is that newlisting data is declining faster than usual. NAR: Total Inventory levels 1.22 million Historically inventory levels range between 2 million and 2.5
The only time this happened was 2006-2011 — the housing bust years. However, 5%-6% mortgage rates did change the marketplace and now 6%-7% mortgage rates are changing behavior so that we see newlisting data declining even more as sellers are calling it quits on their plan to list.
11 of last year found that 27,700 violent crimes had been reported in the city, marking the highest level of violent crime in Chicago since 2011. Although housing market conditions may be challenging heading into the spring season, agents in the inventory-strapped state are optimistic that newlistings will soon be coming to market.
When Gogo Bethke began her career in real estate back in 2011, the Romanian immigrant felt like social media was her only option to generate leads and close deals. “I Instead, the Michigan-based eXp agent created her Facebook business page shortly after passing her licensing exam in 2011 and named it “Gogo’s Real Estate.”. “I
The rate of homes hitting the market was also about one-third stronger than in January 2024 and, at 2533 newlistings, it is the most of any January in four years. That is quite a rebound from late 2024 when only 950 listings hit the market for all home types single-family, townhomes and condos combined.
If you take 2007-2011 out of the equation, we have had only one year go negative; that was 1990, and that was only a 1% decline. Where I disagree with Yun is this: We have more inventory because demand has been softer, and we have more newlistings this year compared to last. That’s a big difference, folks.
Dara’s ability to listen to clients and her attention to detail landed her Exceptional Service Awards in 2011, 2012, and 2013 from Cartus/USAA, one of the nation’s largest relocation organizations. A: My biggest challenge in working with Millennials is to make sure I know more than they know!
2023 produced the lowest number of home sales since 2005 with the exception of 2011. Therefore, we are in a market with the lowest amount of newlistings since 1994. With the exception of 2011, 2023 ended with the lowest number of pending sales since 2000. The opposite is happening now. Pending Sales Decreased by 17.7%
Sales were down in all three categories: Single family sales down by 22.4%: 9,565 in 2023 from 7,420 in 2022 Condo sales down by 21.7%: 2,152 in 2023 from 1,685 in 2022 Multi-family sales down by 28.2%: 2,036 in 2023 from 1,462 in 2022 The bar chart below illustrates that sales in 2023 reached their lowest point since 2011.
You can see this is the second year in a row that sales have been down since the 2020 COVID market, but now in 2023, sales are the lowest they’ve been since 2011. Consequently, we’re witnessing the lowest number of newlistings since 2000.
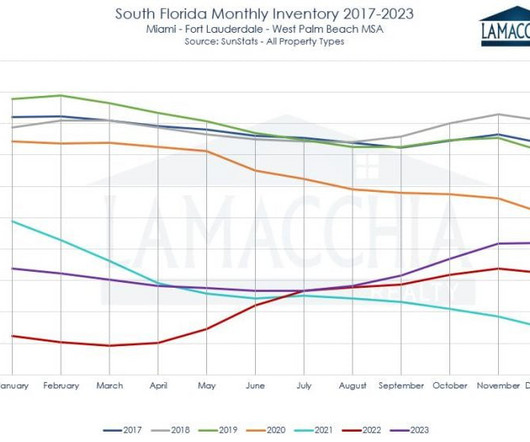
In the chart below you’ll see that the number of single-family homes sold is the lowest it has been in South Florida since 2011. 2023 Sees the Lowest Number of Homes Listed in Fifteen Years There was a 10% decrease in the number of newlistings compared to 2022, with 113,883 homes listed in South Florida, down from 126,545.
2024 Listings Rise for the First Time in Two Years After two years of significant decreases in the number of homes listed, with last year being lowest amount of newlistings since 1994 , 2024 exhibited a 7.7% rise in the number of listings. Pending Sales Increased by 4.2%
2024 Listings Rise for the First Time in Two Years After two years of sharp declines in home listings , including 2023’s record low since 1994, 2024 saw a 10.1% increase in newlistings. However, as circumstances changed, many decided it was time to move on, leading to a notable rise in listings.
2024 Listings Rise for the First Time in Two Years After two years of significant declines in home listings , including a record low in 2023 since 1994, 2024 saw a 10% increase in newlistings. However, as circumstances changed, many sellers decided it was time to move on, leading to a noticeable rise in listings.
2024 Listings Rise for the First Time in Two Years Connecticut has experienced a steady decline in listings since 2015. increase in newlistings. As circumstances evolved, more sellers chose to move forward, contributing to a noticeable rise in listings. Pending Sales Decreased by 1.1%
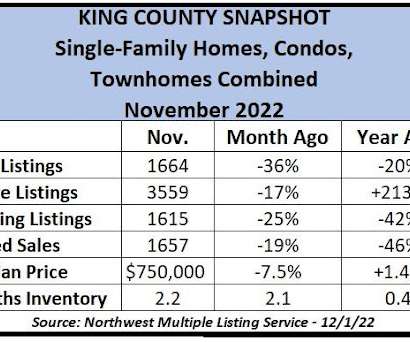
This year’s “cold down” is stark, with 36% fewer newlistings and about 26% fewer homes under contract (Pendings) for all King County home types combined as well as single-family structures alone – and that’s simply from October to November. Read my real estate forecast blog post after you finish the newsletter to learn more!)
Sales activity across the county is at historic lows; no October has experienced fewer listings in King County – not even close – since at least 1992 when records were first archived online. Newlistings for all home types in King County stood at 2157, a whopping 25% drop from September to October. Closed sales fell 0.9%
Most notably, it’s the first time mortgages declined from Q1 to Q2 since 2011, according to ATTOM Data Solutions. averaged a 17% home-price rise from Q2 of 2020 to Q2 of 2021 and prices have risen nationally each quarter since Q3 of 2011. >> The pandemic seriously affected U.S. New data show this subset of buyers accounted for 2.8%
Between 2011 and 2019, the median household income in our area increased by about 34% but housing prices jumped 78%. That includes 621 fewer Pending contracts in April 2022 than the previous April, as the net number of newlistings remains on average lower than in years past. It will help sell this 3-bed, 5-bath , 4690 sq.
The gross-flipping profit of $67,000 in Q2 translates into a 34% return on investment compared to the original acquisition price, its lowest point since Q1 of 2011, when the housing market was recovering from a price slump brought on by the Great Recession. Newlistings are up 6.3% in Q2, down from 6.8% OCTOBER HOUSING UPDATE.
That’s up from 36% of sales in 2022 but far from the peak this century of 45% in 2011, according to ATTOM. >> The reason, beyond the seasonal spring burst of newlistings, may be tied to a recent legal settlement between Insignia’s Homeowners Association and Bosa Development Washington on a litany of building defect claims.
The King County housing market has seen inventory increase by 55% in the past month, while the number of homes going under contract fell 22% from May to the lowest June level since 2011. While the number of newlistings in June jumped 8.2% The fresh data show a clear slowing of the housing market.
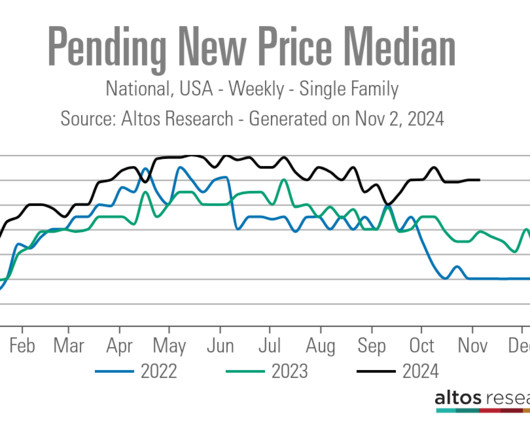
The newlistings data we track with Altos Research is trending at the lowest levels ever during the past few years, while back then it was running at accelerated levels. Look at the difference between this week in 2024 versus the same weeks in 2009-2011. Here is an example with our Nov.
Newlistings data had a slight increase this week from 60,066 to 60,819. However, for 2024, we’ve seen inventory growth and no newlistings data from stressed sellers. However, for 2024, we’ve seen inventory growth and no newlistings data from stressed sellers.
The county has completed only 19,868 total home sales this year, which is the lowest figure since 2011 when 18,930 homes sold through the first 10 months. The number of newlistings across King fell by roughly 20% from September, a common occurrence this time of year as households shift their focus to family, football and festivities.
We organize all of the trending information in your field so you don't have to. Join 9,000+ users and stay up to date on the latest articles your peers are reading.
You know about us, now we want to get to know you!
Let's personalize your content
Let's get even more personalized
We recognize your account from another site in our network, please click 'Send Email' below to continue with verifying your account and setting a password.


Let's personalize your content