This site uses cookies to improve your experience. To help us insure we adhere to various privacy regulations, please select your country/region of residence. If you do not select a country, we will assume you are from the United States. Select your Cookie Settings or view our Privacy Policy and Terms of Use.
Cookie Settings
Cookies and similar technologies are used on this website for proper function of the website, for tracking performance analytics and for marketing purposes. We and some of our third-party providers may use cookie data for various purposes. Please review the cookie settings below and choose your preference.
Used for the proper function of the website
Used for monitoring website traffic and interactions
Cookie Settings
Cookies and similar technologies are used on this website for proper function of the website, for tracking performance analytics and for marketing purposes. We and some of our third-party providers may use cookie data for various purposes. Please review the cookie settings below and choose your preference.
Strictly Necessary: Used for the proper function of the website
Performance/Analytics: Used for monitoring website traffic and interactions
Going into 2023, people thought housing inventory would skyrocket, home prices would crash, and we would see the housing market of 2008 all over again. Looking back on 2023, the inventory story was a big surprise even as mortgage rates headed toward 8%, as the data below will show. Weekly inventory change (Dec.
Since 2020, the seasonal bottom for housing inventory has arrived several months later than normal, making it more complicated to track housing inventory data. Still, we have some promising signs that we might have finally hit the inventory bottom for 2023.
Housing inventory is growing, but national home prices aren’t dropping dramatically, as the recent S&P CoreLogic Case Shiller index clearly showed. The rules of supply and demand economics always end up winning and weekly newlisting data is key. Last week, we saw a positive inventory growth of 11,638 !
On Friday NAR reported that total housing inventory levels broke under 1 million in December, dropping to 970,00 units for a population of 330 million people. million in January down to about 4 million in December, We now have total inventory levels near all-time lows again. During that period, we saw newlisting data decline.
months’ worth of housing inventory in the U.S. If we are trending below 4 million — a possibility with newlisting data trending at all-time lows — then we have much weaker demand than people think. For some historical context, back in 2011, this data line was 101 days. Unsold inventory sits at a 2.6-month
Weekly housing inventory data The best housing story for 2024 so far is that inventory is growing yearly. The growth isn’t just in active inventory but also newlistings. Right now we are a tad below the levels we saw in 2022 before mortgage rates spiked over 6%. When rates fall, they go lower than an average year.
Real estate professionals throughout the state attribute the resilience of the state’s housing market to its perpetually low inventory problem. Inventory is almost nonexistent,” said Melissa Kingsbury , a Redfin agent who works in the southwest suburbs of Chicago. “If As of Feb. Across the state, as of Feb. 1 through Dec.
In addition, this is the fourth straight month of inventory declining, while days on the market are growingl! “The principal factor was the rapid increase in mortgage rates, which hurt housing affordability and reduced incentives for homeowners to list their homes. Plus, available housing inventory remains near historic lows.”
If so, what will this do to inventory levels? Weekly housing inventory data The positive story for housing in 2024 has been the inventory growth we have seen year-over-year. We survived jobs week and Federal Reserve Chairman Jerome Powell talking to Congress, with mortgage rates ending the week below 7%.
Weekly housing inventory data My favorite housing data line for 2024 has been seeing the increase in inventory year over year. I firmly believe that housing inventory can grow over time when mortgage rates increase and we see weakness in demand. Here is a look at inventory last week: Weekly inventory change (Feb.
Inventory, which has been falling for years, broke to all-time lows in 2020. We didn’t have a seasonal push in inventory in 2020, and things worsened in 2021. Of course, this has brought back some inventory, as demand weakness always creates inventory through accumulation. million active listings, but at just 1.28
Since they were distressed forced sellers, inventory skyrocketed in 2006 and stayed very elevated in 2007 and 2008. Total inventory levels. NAR: Total Inventory levels 1.22 million Historically inventory levels range between 2 million and 2.5 NAR: Total Inventory levels 1.22
The 2022 housing market was savagely unhealthy , with all-time lows in inventory leading to massive bidding wars and price spikes until the Fed put a screeching halt to all of it with rate hikes that resulted in the most significant one-year spike in mortgage rate history. Housing Inventory. Home price s. million in 2023.
Existing home sales have more legs to go lower, especially now that newlisting data is falling. A traditional primary resident seller is also a buyer, which means if they don’t list, they’re not just taking a potential home to be bought off the table — they’re taking a future sale off the books as well. million to 1.28
While the growth rate is cooling monthly, we are still in a savagely unhhealthy housing market trying to get national inventory levels back to pre-COVID-19 levels. From the index : I know it seems strange, but existing home sales are falling, and the monthly supply of new homes is at 10.9 Housing inventory issue with no booming demand.
If I am wrong and mortgage rates go lower for longer and we don’t get more newlistings in 2024, then home prices can grow faster in 2024 because we will have the same issue as before: too many people chasing too few homes. So, this is something to consider only if we see an increase in stressed inventory.
Remember, with median sales prices and inventory, it’s very seasonal. Something notable about this report: Total active listings as the NAR tracks them almost broke under 1 million again. However, remember, the dive in inventory is normal at this time of the year. Below are charts with today’s report and the trend.
With regular reports and data coming out on what’s blocking inventory growth, the biggest factors impacting rates and the latest shifts in home sales, there’s a lot of information out there to help you inject more confidence into your business strategy. Logan Mohtashami: Inventory is still savagely unhealthy.
2023 was a notable year in real estate history, but if we had to put our finger on what stood out, it was how the number of homes listed was the lowest in over two decades. It kept inventory down, which propped up prices, but sales are down nearly 22%, and buyers are hungry. A lot of it had to do with anemic inventory.
The market’s resilience can be attributed more to the decrease in inventory than the decline in sales. Lowest number of homes listed in recorded history, down 19.5% The decline in inventory has made it impossible for prices to decrease due to demand. Fast forward to the present, and no crash has occurred.
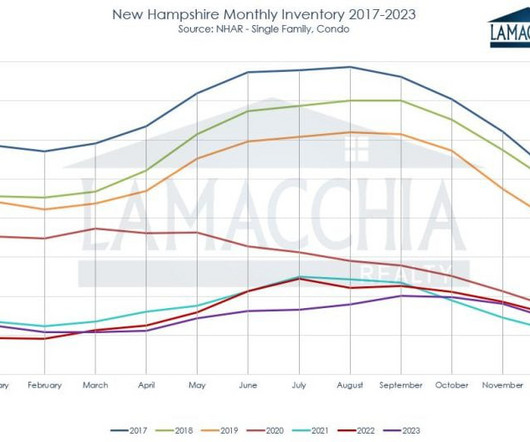
The real estate landscape witnessed significant developments in 2023, as the New Hampshire market saw a historic low in listings. This scarcity in inventory exerted upward pressure on prices, although it coincided with a 19% decline in sales. Lowest number homes listed in recorded history, decreased by 15.1%
This report breaks down sales, average prices, the number of active listings, and how many listings went under contract for 2024 compared to 2023 and discusses what is predicted to unfold in 2024. The number of homes listed increased by 10.1% increase in newlistings. Average Prices Increase by 11.2%
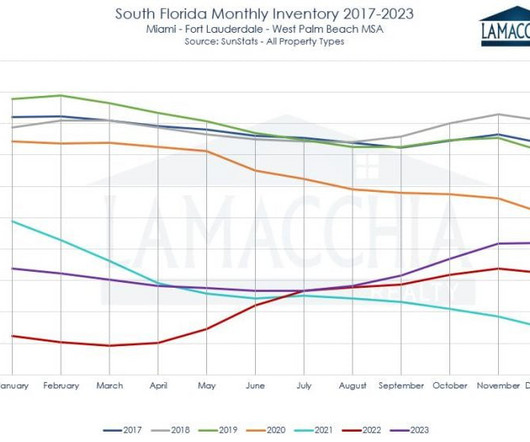
The 2023 South Florida real estate market, like national trends, saw a decrease in sales, an increase in prices, and a decrease in the number of homes listed and placed under contract. Unlike what the Northeast experienced, South Florida inventory is up over 2022 and the second half of 2021. South Florida Sales Decline by 17.5%
In 2024, the Massachusetts real estate market saw slightly more sales and higher prices than 2023, reflecting national trends driven by strong demand and limited inventory. The number of homes listed increased by 7.7% As long as inventory is tight and buyers are competing for homes, prices will continue to hold firm.
Dara’s ability to listen to clients and her attention to detail landed her Exceptional Service Awards in 2011, 2012, and 2013 from Cartus/USAA, one of the nation’s largest relocation organizations. A: The obstacles Millennial real estate buyers face for owning a home in the Boston market come down to low inventory.
This report breaks down sales, average prices, the number of active listings, and how many listings went under contract for 2024 compared to 2023 and discusses what is predicted to unfold in 2024. The number of homes listed increased by 10.0% Inventory rose over the past two years, giving buyers more selection in the market.
Overall, the 2024 Connecticut real estate market demonstrated rising prices and a slight decrease in sales due to extremely constrained inventory. This report breaks down sales, average prices, the number of active listings, and how many listings went under contract for 2024 compared to 2023 and discusses what is predicted to unfold in 2024.
If you take 2007-2011 out of the equation, we have had only one year go negative; that was 1990, and that was only a 1% decline. To get a real price crash, we would need to see a surge of housing inventory and distressed sellers. So, why haven’t home prices crashed with high mortgage rates this year? million in September.
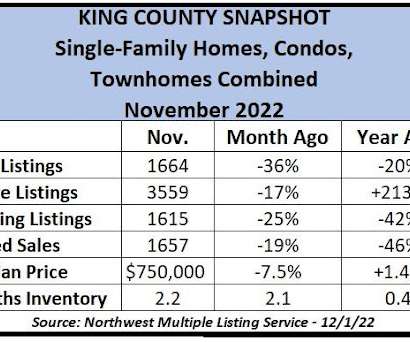
This year’s “cold down” is stark, with 36% fewer newlistings and about 26% fewer homes under contract (Pendings) for all King County home types combined as well as single-family structures alone – and that’s simply from October to November. months of inventory. Inventories across the county for all home types now stand at 2.2
There are no signs of a real estate crisis, particularly in the Puget Sound region, where prices keep rising – up about 20% the past year and 68% in Seattle alone since 2016, by one measure – amid a dearth of inventory and surge of buyers. New data show this subset of buyers accounted for 2.8% Active listings as of Sept.
Worsening affordability issues and lower-than-usual inventory have prompted many consumers to watch this housing market from the sidelines – without the picket lines. Newlistings for all home types in King County stood at 2157, a whopping 25% drop from September to October. Single-family inventory narrowed to 1.7
The gross-flipping profit of $67,000 in Q2 translates into a 34% return on investment compared to the original acquisition price, its lowest point since Q1 of 2011, when the housing market was recovering from a price slump brought on by the Great Recession. Newlistings are up 6.3% Inventories improved fractionally.
The King County housing market has seen inventory increase by 55% in the past month, while the number of homes going under contract fell 22% from May to the lowest June level since 2011. While the number of newlistings in June jumped 8.2% While the number of newlistings in June jumped 8.2% in May to 1.3
Housing inventory nationwide flipped from oversupply to undersupply about a dozen years ago when consumers and the banking industry began to slowly rebound financially from the Great Recession. America’s shortfall is most acute with the most vulnerable, as affordable housing inventory has been shrinking for decades.
Between 2011 and 2019, the median household income in our area increased by about 34% but housing prices jumped 78%. That includes 621 fewer Pending contracts in April 2022 than the previous April, as the net number of newlistings remains on average lower than in years past. a month ago. Total supply on the Eastside (0.7
The rate of homes hitting the market was also about one-third stronger than in January 2024 and, at 2533 newlistings, it is the most of any January in four years. That is quite a rebound from late 2024 when only 950 listings hit the market for all home types single-family, townhomes and condos combined.
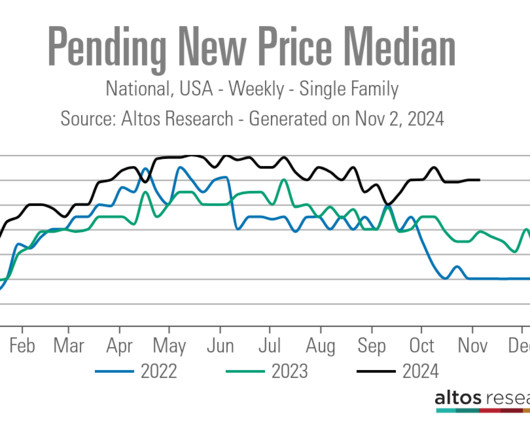
Home prices have remained firm over the last two months, even with higher mortgage rates and inventory data. They misread the price cut percentage and rising inventory data to mean that national home prices had to fall a lot this year. You can have rising inventory, increasing sales and rising prices.
The county has completed only 19,868 total home sales this year, which is the lowest figure since 2011 when 18,930 homes sold through the first 10 months. Inventories will continue to rise as life and job changes lead more owners to put their home up for sale. months’ inventory of single-family homes across the county as of Nov.
We organize all of the trending information in your field so you don't have to. Join 9,000+ users and stay up to date on the latest articles your peers are reading.
You know about us, now we want to get to know you!
Let's personalize your content
Let's get even more personalized
We recognize your account from another site in our network, please click 'Send Email' below to continue with verifying your account and setting a password.


Let's personalize your content