This site uses cookies to improve your experience. To help us insure we adhere to various privacy regulations, please select your country/region of residence. If you do not select a country, we will assume you are from the United States. Select your Cookie Settings or view our Privacy Policy and Terms of Use.
Cookie Settings
Cookies and similar technologies are used on this website for proper function of the website, for tracking performance analytics and for marketing purposes. We and some of our third-party providers may use cookie data for various purposes. Please review the cookie settings below and choose your preference.
Used for the proper function of the website
Used for monitoring website traffic and interactions
Cookie Settings
Cookies and similar technologies are used on this website for proper function of the website, for tracking performance analytics and for marketing purposes. We and some of our third-party providers may use cookie data for various purposes. Please review the cookie settings below and choose your preference.
Strictly Necessary: Used for the proper function of the website
Performance/Analytics: Used for monitoring website traffic and interactions
The rules of supply and demand economics always end up winning and weekly newlisting data is key. Newlisting data is growing year over year, but it will be the second-lowest newlisting data ever recorded in history. With more sellers who are buyers, we have a tad more demand this year.
After 2010, qualified mortgage laws were in place, meaning everyone getting a mortgage has to be able to repay the loan. Since most sellers are buyers, inventory should be stable if demand is stable. This is what happened post 2010: The millennials started to buy homes in 2013 and they finance 90% of those homes.
.” One of the housing economic realities that I have been trying to stress this year is that a traditional seller of a home is typically a buyer as well. This explains why total active listing inventory data has been stable over the decades, with the exception of 2006-2011, when those forced distressed credit home sellers couldn’t buy.
This is a byproduct of the qualified mortgage rule of 2010, which has been a game-changer not only for the housing market but for the overall U.S. But one positive reason for the low inventory is that homeowners have great financials and aren’t being forced to sell their homes out of stress. NAR: Total existing-home sales receded 4.3%
Elevated mortgage rates and high home prices pushed sales of existing homes down again in October to the lowest monthly pace since August 2010. While circumstances for buyers remain tight, home sellers have done well as prices continue to rise year-over-year, including a new all-time high for the month of October,” Yun said. “In
In 2010, more than 23% of homes in America were underwater. Our newlisting data for that time period shows there were between 250,000 and 400,000 newlistings per week as many sellers with underwater mortgages were forced into a distressed market.
Home Prices will fall, but don’t expect 2010. There will be two key differences between 2023 and 2010. As many were quick to point out at the time, the number of newlistings coming onto the market had not fallen. The event is exclusively for HW+ members , and you can go here to register. months nationally.
I don’t need to see total active listing get back to the historical range of 2-2.5 Newlistings are declining now. One of the issues with existing home inventory has been that, for the most part, a traditional seller is usually a buyer of a home. This is not encouraging news at all, in my view. From Redfin.
Since 2010, Bluff ton’s population has nearly tripled to about 34,000 making it one of America’s fastest growing towns. This rapid increase in prices, coupled with local housing inventory dropping over 50% in 2021, has meant times are tough for buyers looking to settle in Bluffton. Where are all these buyers coming from, you ask?
If we are trending below 4 million — a possibility with newlisting data trending at all-time lows — then we have much weaker demand than people think. are different post-2010. As expected, existing home sales fell from February to March since the previous month’s report was intense. Now if we get a few sales prints above 4.6
Credit channels and inventory channels both changed after 2010 because of the qualified mortgage laws and the 2005 bankruptcy reform laws. There is a better case that we can get below 4 million if mortgage rates stay high and newlisting data starts its seasonal decline in the data. million units, up 3.8% from April but down 6.1%
While housing market trends in the first quarter of 2022 resembled the previous year’s trend — buyer frenzy, homes selling over the asking price and continued home price appreciation — much has changed in the spring, which will impact some of the previously forecasted scenarios. To register for the HW+ event, go here. The road ahead.
Even as mortgage rates rose, and affordability was pushed out of reach for many potential homebuyers, there are still sufficient buyers who can afford these prices and these rates. The number of buyers has been surprising. The median price of the newlistings this week is $399,900. Home prices declined subsequently.
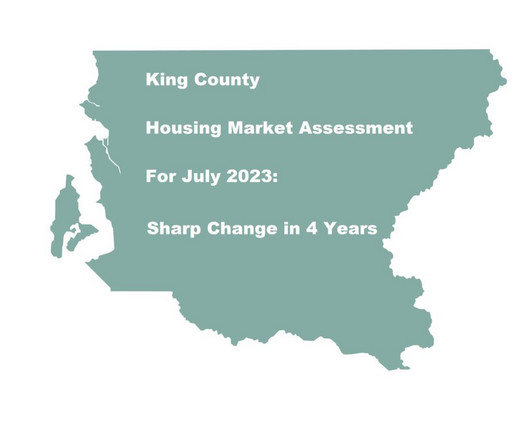
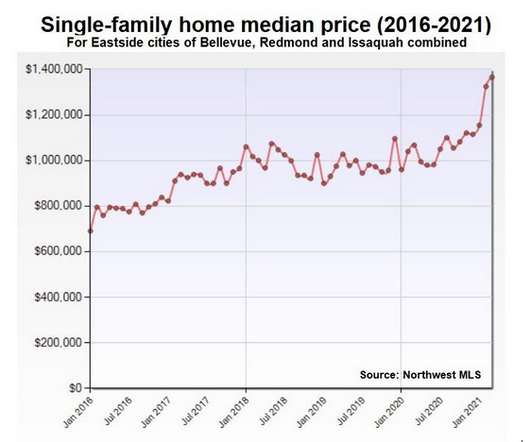
Ah, for the good old days of 2019 – when we could stomach home prices closer to the mid-million-dollar mark and housing options were somewhat plentiful amid a mildly competitive buyer environment. King County newlistings fell 13% from June to July (2158), led by a 20% slide in Seattle (690). on the Eastside. The county saw a 4.9%
Now that the Federal Reserve has cut interest rates, home buyers should swarm the market with low-interest mortgages …. Buyers who enter the market now will enjoy some of the best selection of homes since before the pandemic as supply grows, competition wanes and home prices slip. The number of Active listings is another eye-opener.
November newlistings fell by about half of the previous month’s rate while home prices saw a welcome decline. Even with mostly lower prices, affordability remains the biggest challenge for buyers as mortgage interest rates climbed toward 7%. The number of newlistings tumbled 48% from October and was down 2.7%
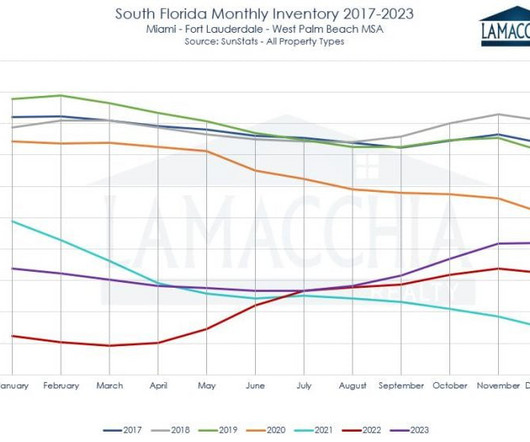
That said, the number of homes sold is down year over year, so it’s a true sign that the voracious buyer activity has slowed down and that this region is a bit ahead of the North in the market adjustment cycle. Condo sales are at the lowest point since 2010. South Florida Sales Decline by 17.5% South Florida witnessed a 17.5%
This created an extreme scarcity of inventory and contributed to elevated prices, but it also led to a 22% decrease in the number of sales, leaving buyers eager. The decline can be attributed partly to buyers grappling with the affordability challenges posed by higher interest rates and continuously escalating prices.
According to the latest census, the population in Raleigh grew by almost 64,000 residents between 2010 and 2020. Raleigh Real Estate Supply Raleigh is currently in a buyer’s market, which means there are more homes for sale than available buyers. This means buyers have more power to negotiate for lower pricing.
The market is spooking many potential buyers and sellers thanks to stubbornly high mortgage interest rates. Only buyers and sellers who must move are doing so. fewer newlistings, the rate of sales rose 1.7% fewer newlistings (1998) compared to July and 5.0% While there were 5.8% against the previous month.
Annual sales across King County totaled 21,515 homes – down an incredible 24% from the year before and the fewest since 2010 (20,761). The market is now in the process of thawing after a lengthy cool down, as buyers begin anew to seek change in their home dynamics. That’s a whopping 134% more than December and a solid 7.0%
The affordability question is becoming more difficult to justify too, as home prices and interest rates rise amid other challenges facing buyers.“That’s Buyers with the deepest pockets may wait, however. between 2010 and 2020 to edge out Denver (22.9%) and Portland, Ore.-Vancouver, home buyers. Vancouver, Wash.
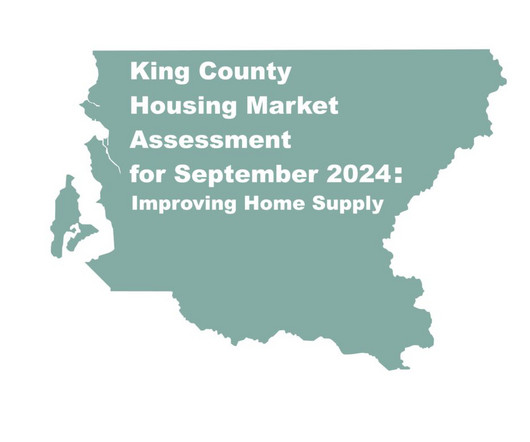
This is the season when buyers can take advantage of homeowners wishing to sell before the holidays and are showing a willingness to budge on price or make other concessions. We are starting to see all of those signs following the release of September housing data from the Northwest Multiple Listing Service (MLS). 1 and Oct.
The Eastside led the way with a 33% drop-off in newlistings (420) and Seattle fell 31% (586). By comparison, there were exactly 2900 newlistings across our county in November 20 years ago. King County’s 1474 monthly home sales is the lowest for any November since 2010 (1331) – in the middle of the housing crisis.
The region’s real estate scene in 2023 will be remembered for rising home prices and scant newlistings. Buyers and sellers tiptoed through caution. As the year dims, all eyes fixate on 2024’s potential: a hopeful dance fueled by dreams of lower rates and a wave of new homes for sale. Um, bye-bye! The number of U.S.
Buyers faced challenges with affordability due to rising interest rates, inflation, and increasing home prices, yet they remained steadfast and determined. The market favored sellers in the beginning of the year but shifted toward buyers with a burst of activity later in the year, and a rebound is expected in 2025. Sales Decline by 1.7%
Beyond labor strife, America’s home buyers and sellers appear to be on strike as well. October figures from the Northwest Multiple Listing Service strongly suggest prospective buyers and sellers are taking a wait-and-see approach. Newlistings in King were off 26% month-to-month (1583) and Active listings were down 9.4% (2296).
More buyers are making larger down payments. Buyers in the U.S. >> Through February, the number of existing home listings across the U.S. offers made on every sold home in February, NAR reported, and properties across the nation are currently finding a buyer in a record-low 20 days on average. >>
Bottom line: Buyers should factor this potential tax increase into their budgeting plans when buying a home, as property taxes can significantly affect the overall cost of ownership. Thats up from 63% in 2010. Science and engineering degrees led the recent surge, increasing from a share of 43% in 2010 to 52% today.
Waller went on to say this adjustment is in no way like the horrific housing/financial crises of 2007-2010. At least buyers will have more options and time to weigh their decision to purchase a home – but at what cost to the bottom line? The next 12-24 months are likely going to be quite a challenge for prospective buyers.
That’s where buyers are paying about 42% more in their monthly mortgage payments for the same house today than they did a year ago. Sidenote: Adjustable-rate mortgages (ARMs), which typically have lower interest rates than fixed-rate mortgages, have become an attractive option for newbuyers financing a home.
Amid the challengers for buyers, there is an expectation for housing activity to continue puffing its Thomas the Tank Engine without a misfire – at least through early summer – before possibly lowering a gear. One of the reasons for the continued home-sales intensity – in any season – is a key group of “new” buyers.
That median figure is the smallest measure for a home since 2010 and marks a reversal after a brief increase during the post-Covid building boom. >> This is the season when buyers can take advantage of homeowners wishing to sell before the holidays and who show a willingness to budge on price or make other concessions.
Memories of the Great Recession still linger for anyone linked to the real estate industry – including the estimated seven million households that lost their homes to foreclosures around 2008-2010. Flood of buyers – As I noted last month , Millennials will fuel this housing market for at least a decade to come as about 4.5
The rate today is the same as in the late 1960s, except during the housing bubble of 2008-2010 when ownership rose – and we know how that ended up! As home prices surge and people delay – or forgo – nuptials, buyers are pooling their finances with unmarried partners, roommates or friends to purchase a place. was $1889. >>
The Biden administration’s $2T infrastructure plan includes $213B allocated for housing, with a focus on low- and middle-income homeowners and potential buyers. >> The City of Kent reported home prices increased 88% between 2010 and 2018, while incomes for homeowners rose 11% in that time. POTENTIAL TAX SAVINGS. There is 1.1
In many markets, home prices are lower than where they were a year ago, so I imagine some buyers are finding opportunity where they have felt thwarted for many years. Newlistings Why is inventory rising when sales are rising? We can track homeseller sentiment changing in the weekly newlistings data.
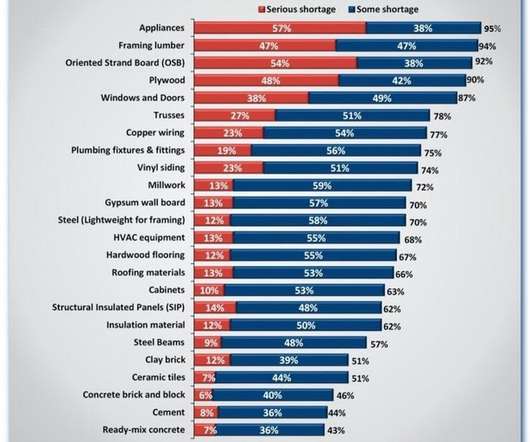
SPOTTING TRENDS Builders are hearing from prospective buyers: Developers are being asked to create stylish and functional homes with little compromise on size and at lower prices. Annual sales across King County totaled 21,515 homes – down an incredible 24% from the year before and the fewest since 2010 (20,761). It’s a 3-bedroom, 1.75-bathroom
We organize all of the trending information in your field so you don't have to. Join 9,000+ users and stay up to date on the latest articles your peers are reading.
You know about us, now we want to get to know you!
Let's personalize your content
Let's get even more personalized
We recognize your account from another site in our network, please click 'Send Email' below to continue with verifying your account and setting a password.


Let's personalize your content