This site uses cookies to improve your experience. To help us insure we adhere to various privacy regulations, please select your country/region of residence. If you do not select a country, we will assume you are from the United States. Select your Cookie Settings or view our Privacy Policy and Terms of Use.
Cookie Settings
Cookies and similar technologies are used on this website for proper function of the website, for tracking performance analytics and for marketing purposes. We and some of our third-party providers may use cookie data for various purposes. Please review the cookie settings below and choose your preference.
Used for the proper function of the website
Used for monitoring website traffic and interactions
Cookie Settings
Cookies and similar technologies are used on this website for proper function of the website, for tracking performance analytics and for marketing purposes. We and some of our third-party providers may use cookie data for various purposes. Please review the cookie settings below and choose your preference.
Strictly Necessary: Used for the proper function of the website
Performance/Analytics: Used for monitoring website traffic and interactions
The rules of supply and demand economics always end up winning and weekly newlisting data is key. Newlisting data is growing year over year, but it will be the second-lowest newlisting data ever recorded in history. This contract data will grow if mortgage rates head lower and stay lower.
But since we have such low active listings today, even with 2024 being another year of low home sales, the days on the market are still under 30 days, which means homes that are priced right are selling quickly. Newlistings The most significant and glaring difference between 2011 and 2024 is the weekly newlistings data for the peak season.
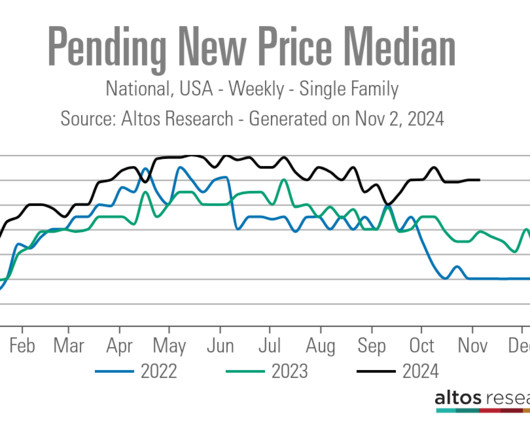
The median price of the newlistings this week is $399,900. As the summer progresses, each subsequent week of newlistings gets priced at a slight discount to the previous weeks. The median price of the homes in contract is $385,000. There are now 376,000 single-family homes in contract.
This report breaks down sales, average prices, the number of active listings, and how many listings went under contract for 2024 compared to 2023 and discusses what is predicted to unfold in 2024. Average prices for closed sales increased by 11% The number of homes listed increased by 12.5% Pending Sales Decreased by 9.8%
Meantime, the number of contractlistings – known as Pending sales – rose 6.1% Realtor.com reported that our broader market (including Bellevue and Tacoma) experienced the sharpest rise in newlistings compared with last year, up 42%. The number of Active listings is another eye-opener. was up 27% YoY.
The sellers custom built the home between 2007 and 2009, using high-end materials and finishes, including a wall of windows and 26-foot-high ceilings in the great room. In Bakersfield, for example, Golden Empire MLS participants can submit a form to post newlistings, open houses and price changes. percent from 7.16
The number of buyer-seller contracts in one month tends to be a preview of the next month’s sales figures; deals typically take 4-6 weeks to close after going Pending. The number of newlistings fell off the cliff in July, down 23% in Seattle (323 units), off 15% on the Eastside (261) and 14% across the county (770).
The county saw the combined number of single-family, townhome and condo listings increase in June by 4.4% While that percentage may appear strong, it’s nothing compared to the April-to-May rise of 18%, signaling a probable cooling of newlistings in the future. New single-family-home listings rose 3.8%
month backlogs of contract work, as of Q4 (latest data available), which is down from the peak of 4.8 Except for the pandemic year of 2020, last month was the slowest April since at least 2008 when easy access to Northwest Multiple Listing Service data became available. Check out the listing’s lookbook and cinematic video flythrough.
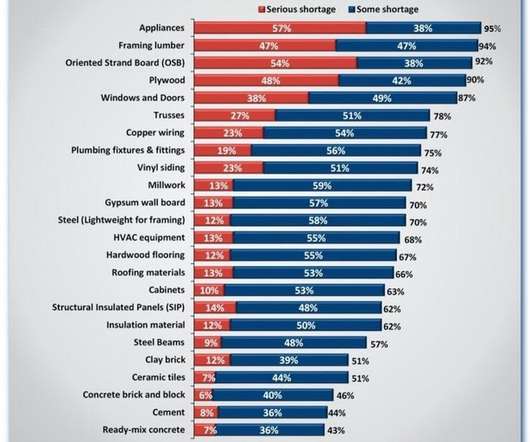
More than 90% of builders in May reported shortages of appliances, framing lumber and other wood products: To address rising costs, some 47% of builders surveyed this spring say they are including price-escalation clauses in their sales contracts to avoid a deeper hit on their bottom lines. High demand kept supply depleted. months (from 0.7)
Pending contracts First, we must realize that we are working with the third calendar year of the lowest home sales ever recorded, once you adjust that number to the workforce. Newlistings data had a slight increase this week from 60,066 to 60,819. To this date, these principles still apply.
The most interesting developments came within the single-family-home category: The number of newlistings in August fell 7.5% in one month, to 2242 homes, according to data from the Northwest Multiple Listing Service – signaling the start of a seasonal slowdown. List: $5.2M ($1109/sq. stronger YoY. bath , 3750 sq.
We organize all of the trending information in your field so you don't have to. Join 9,000+ users and stay up to date on the latest articles your peers are reading.
You know about us, now we want to get to know you!
Let's personalize your content
Let's get even more personalized
We recognize your account from another site in our network, please click 'Send Email' below to continue with verifying your account and setting a password.


Let's personalize your content