This site uses cookies to improve your experience. To help us insure we adhere to various privacy regulations, please select your country/region of residence. If you do not select a country, we will assume you are from the United States. Select your Cookie Settings or view our Privacy Policy and Terms of Use.
Cookie Settings
Cookies and similar technologies are used on this website for proper function of the website, for tracking performance analytics and for marketing purposes. We and some of our third-party providers may use cookie data for various purposes. Please review the cookie settings below and choose your preference.
Used for the proper function of the website
Used for monitoring website traffic and interactions
Cookie Settings
Cookies and similar technologies are used on this website for proper function of the website, for tracking performance analytics and for marketing purposes. We and some of our third-party providers may use cookie data for various purposes. Please review the cookie settings below and choose your preference.
Strictly Necessary: Used for the proper function of the website
Performance/Analytics: Used for monitoring website traffic and interactions
The housing market got some much needed relief in the fall when mortgage rates began to drop, but it was short lived. Despite two interest rate cuts by the Federal Reserve, mortgage rates rose again and remain stubbornly high. A substantial drop in newlistings is a contributing factor.
But I need to explain why this level has more in common with 2014 housing data than the credit stress markets of 2005-2008, and why you should care. In the summer of 2020, I talked about how the housing market would change, but it needed the 10-year yield to break over 1.94%, which roughly means 4% plus mortgage rates.
Since the weaker CPI data was released in November, bond yields and mortgage rates have been heading lower. The question then was: What would lower mortgage rates do to this data? However, mortgage rates have fallen more than 1% since the recent highs, so it’s time to look at the data to explain how to interpret it.
After 2010, qualified mortgage laws were in place, meaning everyone getting a mortgage has to be able to repay the loan. You can see the drastic change this made in the Mortgage Bankers Association Credit Availability index , below, which skyrocketed in 2005 and 2006 before an epic collapse in 2008.
Instead of making up for the shortfall, newlistings have slumped further in 2021. Year-over-year, newlisting volumes were down 16% in January and 21% in February — amounting to a 125,000 deficit in inventory compared to the same time in 2020. year-over-year in January, the most growth in a single year since 2005.
“The principal factor was the rapid increase in mortgage rates, which hurt housing affordability and reduced incentives for homeowners to list their homes. This means what we saw in 2005-2008 with the inventory spike was a historic event that hasn’t been replicated at any time in recent U.S. economic history. .
However, we haven’t had a credit sales boom like the one we saw from 2002-2005. Total Inventory had been growing from 2001-2005; total listings data in 2005 was at the higher historical range of 2.5 million listings. Today, we stand at 1,310,000 active listings. Newlistings are declining now.
Mortgage rates fell even though the jobs report was stronger than anticipated. They reversed their bearish take on bonds, and people started to buy the 10-year yield, causing mortgage rates to fall. As a result, mortgage rates, which climbed as high as 7.05% last week, fell to a low of 6.76% on Friday. million in 2023.
From NAR : “December was another difficult month for buyers, who continue to face limited inventory and high mortgage rates ,” said NAR Chief Economist Lawrence Yun. However, expect sales to pick up again soon since mortgage rates have markedly declined after peaking late last year.” During that period, we saw newlisting data decline.
The spring housing market music is playing, and purchase application data and active listing inventory rose together last week. The other focus should be where mortgage rates go; only a little happened last week. In 2007, when sales were down big, total active listings peaked at over 4 million.
Just when I thought it was safe to say we were getting more traditional spring housing inventory , we hit a snag last week, as active inventory and newlistings declined. We had a lot of drama over the week between Federal Reserve meetings and banking stress, and mortgage rates and purchase applications both fell.
Yes, we found the seasonal bottom for housing inventory on April 14, but this year’s rise in active listings has been tepid at best. Here’s a quick rundown of the last week: Total active listings grew 662 weekly, and newlisting data is still trending at all-time lows. This doesn’t appear to be the case for 2023.
Today’s housing market suffers from affordability issues due to mortgage rates in the 7s and high home prices. But since we have such low active listings today, even with 2024 being another year of low home sales, the days on the market are still under 30 days, which means homes that are priced right are selling quickly.
While the homebuilders weren’t surprised by the better-than-estimated new home sales report released Friday, some people were a bit shocked. 9 up until the early part of February as mortgage rates fell from 7.37% to 5.99%. To combat higher mortgage rates, builders have been cutting prices and buying down rates to move product.
Existing home sales When mortgage rates started to rise earlier this year, existing home sales trended lower. As you can see in our newlisting data, we are showing growth. However, if mortgage rates went lower and stayed lower, everyone would be selling more homes today. The inventory of unsold existing homes grew 6.7%
As mortgage rates rose more and more, the October to January data was going to show big negative prints. Seasonal impacts are the norm with housing, and newlisting data is negative 6% year to date. We saw newlisting data decline when rates got to 6.25% the first time. NAR lists the current inventory at 1.22
The 2022 housing market was savagely unhealthy , with all-time lows in inventory leading to massive bidding wars and price spikes until the Fed put a screeching halt to all of it with rate hikes that resulted in the most significant one-year spike in mortgage rate history. Mortgage rates. So where does all that drama leave us for 2023?
To top it all off, we started 2022 at all-time lows, forcing bidding action everywhere until mortgage rates rose. And we aren’t talking about your grandfather’s mortgage rates rising; we went from 2.5% However, with price growth and mortgage rates skyrocketing, the hit to affordability is historic. Currently, we are at 3.2
Credit channels and inventory channels both changed after 2010 because of the qualified mortgage laws and the 2005 bankruptcy reform laws. Once mortgage rates rise in this environment, it can lead to big-time demand destruction, which is what has happened. million would mean much better mortgage demand. million in May.
The truth is that if mortgage rates fell below 5.875% and kept going lower, everyone’s housing predictions would need to be revised this year because the builders can sell their homes with lower mortgage rates. economy isn’t in recession today, and mortgage rates have risen almost 1% from the recent lows.
If we are trending below 4 million — a possibility with newlisting data trending at all-time lows — then we have much weaker demand than people think. million before we saw the massive stress spike in supply from 2005 to 2007. We have a workable range for 2023 sales in the existing home sales market between 4 million and 4.6
According to multiple real estate agents and mortgage brokers, low interest rates and a high percentage of “essential” jobs in their town has kept the housing market and local economy strong. Moreover, 30% of El Paso shoppers are looking at local homes from out-of-state, with top views coming from New York, Albuquerque, and Los Angeles.”.
Why are home prices still rising even as mortgage rates have gone higher? A number of people predicted that home prices would experience a steep drop as mortgage rates rose, but that’s not what has happened. This is not a new idea — I’ve been dealing with people predicting a housing crash since 2012.
With rates trying to reach equilibrium after their nosedive in 2020, everyone has had to accept that pandemic-era rates are a thing of the past and therefore higher monthly mortgage payments are here to stay. 2023 produced the lowest number of home sales since 2005 with the exception of 2011. Will the 2024 Real Estate Market Improve?
Many sellers were reluctant to list due to low pre-pandemic mortgage rates, but increased activity emerged from necessity and life changes , with competitive pricing becoming essential. 2024 was the third lowest number of homes sales since 2005, only slightly higher than 2023. rise in the number of listings.
In 2024, the New Hampshire real estate market experienced slightly more sales and higher prices compared to 2023, aligning with national trends fueled by strong demand and constrained inventory. increase in listings. Many sellers had hesitated to list, holding onto their pandemic-era mortgage rates.
Appraisers Riding the Waves of Up and Down Mortgage Rates Appraisal Business Tips Humor for Appraisers Click here to subscribe to our FREE weekly appraiser email newsletter and get the latest appraisal news!! We are seeing more newlistings across the country, and it’s something we’re also seeing locally.
Homes Listed – All of NH. Newlistings in 2021 followed a less treacherous trendline in 2021 than 2020 but still couldn’t quite keep up with pre-pandemic markets. decrease in the state of New Hampshire brought listings to 27,131 from 28,127 the previous year. Cheshire moved 15.8% from $273,641 to $316,801.
Inventory of homes listed reached a record low by July of 2023 , and mortgage rates increased dramatically, diminishing buyer affordability. Now in 2024, the inventory of homes has been steadily rising, but mortgage rates have recently dipped, so the real estate landscape is still readjusting itself from the frenzied pandemic market.
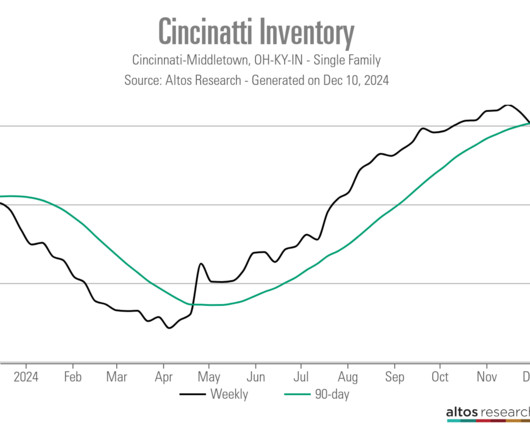
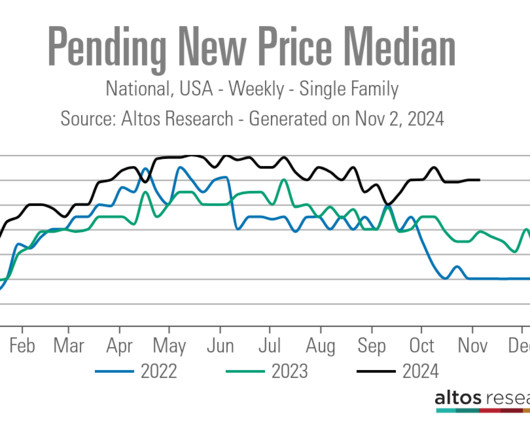
NAR total inventory since 1982: I prefer the Altos Research weekly single-family data to the NAR data because it gives us a fresh look at not only active listing data but newlisting data. The Altos Research newlisting data is essential in tracking the supply aspect of housing, which is why I include it as part of the Tracker.
However, I will give you all the charts to show Uncle Dave that housing credit doesn’t look like it did in 2008 because the qualified mortgage (QM) law makes that impossible. None of that action has been happening for 14 years because the credit market changed after the 2010 qualified mortgage rule.
Home prices have remained firm over the last two months, even with higher mortgage rates and inventory data. I want to show you how the data changed with mortgage rates heading toward 6% so the next time this happens, we have a better idea of what to expect in the housing market. I have long believed that it’s rare in the U.S.
We organize all of the trending information in your field so you don't have to. Join 9,000+ users and stay up to date on the latest articles your peers are reading.
You know about us, now we want to get to know you!
Let's personalize your content
Let's get even more personalized
We recognize your account from another site in our network, please click 'Send Email' below to continue with verifying your account and setting a password.


Let's personalize your content