This site uses cookies to improve your experience. To help us insure we adhere to various privacy regulations, please select your country/region of residence. If you do not select a country, we will assume you are from the United States. Select your Cookie Settings or view our Privacy Policy and Terms of Use.
Cookie Settings
Cookies and similar technologies are used on this website for proper function of the website, for tracking performance analytics and for marketing purposes. We and some of our third-party providers may use cookie data for various purposes. Please review the cookie settings below and choose your preference.
Used for the proper function of the website
Used for monitoring website traffic and interactions
Cookie Settings
Cookies and similar technologies are used on this website for proper function of the website, for tracking performance analytics and for marketing purposes. We and some of our third-party providers may use cookie data for various purposes. Please review the cookie settings below and choose your preference.
Strictly Necessary: Used for the proper function of the website
Performance/Analytics: Used for monitoring website traffic and interactions
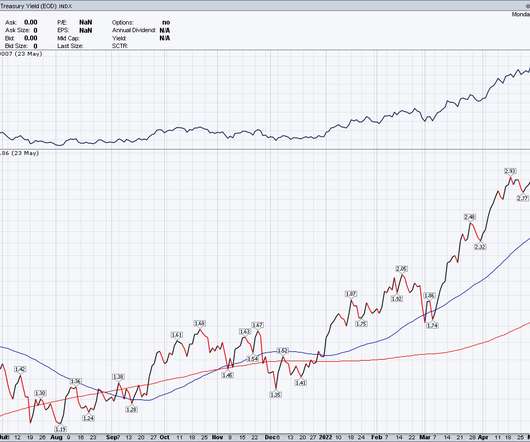
I know some people don’t agree with me on this, but the price gains in both the existing home and new home sales sector show that homebuilders and sellers had too much pricing power and needed to be checked. As you can see, sales levels were never elevated like what we saw from 2002-2005. The only way this happens is by higher rates.
However, what is different this year from 2023 is that we have more sellers that will be buyers. That means that our weekly pending sales contract data is showing growth year over year. Of course, the housing market didn’t have the credit sales boom it had from 2002-2005, but it lacked inventory.
The lack of sellers is also a demand problem and what we saw after June of 2022 is that sellers called it quits earlier and faster in the year than usual, resulting in total existing home sales totaling 5,030,000 to end 2022. So the fact that we are back to an average of 26 days on market makes me happier.
Between 2002-2005 in many markets, the real estate market was scorching, much like it is today. As appraisers, we faced tremendous pressure from buyers, sellers, real estate agents, and loan officers during the previous run-up. We are seeing that as a profession again. Is this any different than last time? How do we combat this?
It created a massive demand for home purchases as consumers competed to win a sales contract and get a home with a low single digit interest rate. It means a massive contraction in demand for mortgages, tighter margins, corporate layoffs and “right-sizing,” and concerns about what the future may hold.
The number of home listings dried up , contracts were canceled , the few buyers still out there demanded concessions , mortgage rates spiked to 7% and homebuilder sentiment hit rock bottom. The 2002 housing market has been a tale of two halves,” said Green. By September, a full-fledged housing market recession had set in.
From NAR Research : “Total existing-home sales notched a minor contraction of 0.4% A traditional primary resident seller is also a buyer, which means if they don’t list, they’re not just taking a potential home to be bought off the table — they’re taking a future sale off the books as well. However, it’s not the market of 2002-2011.
can’t have a credit sales boom like we saw from 2002-2005. The housing construction cycle is over, but the builders will finish their homes under contract and hope rates will fall soon to lock up buyers. With housing post-2020, home sellers and homebuilders had a lot of pricing power and pushed it on the consumer because they could.
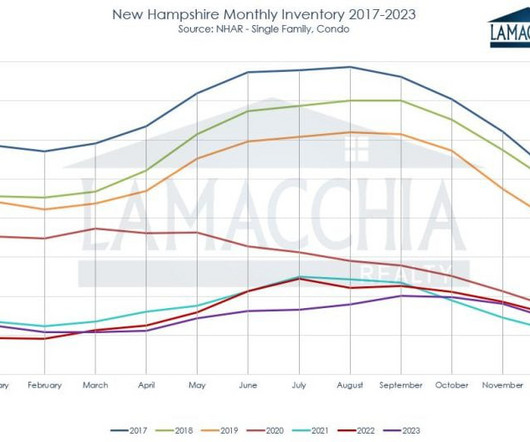
This report breaks down state-wide sales (previous years mostly covered Southern NH and the Lakes Region ), average prices, the number of active listings, and how many listings went under contract for 2023 compared to 2022, and discusses what is predicted to unfold in 2024. Average prices for closed sales increased by 7.2%
Keep them up to date in every step of the report so that they can keep the Lender (and the Buyer/Seller/Realtor/Closing Attorneys when applicable) all in the loop on the progress of the report. percent, but remained close to its highest since 2002,” said Joel Kan, MBA’s Vice President and Deputy Chief Economist. percent from 7.16
For this analysis ATTOM looked at current average home values, 5-year home price appreciation for YTD (Q1-Q3) 2022 vs. YTD (Q1-Q3) 2017, current average home equity, home seller profits, and home flipping rates in U.S. The rural schoolhouse has been on the National Register of Historic Places since 2002. percent from 6.49
The demand is higher and there are good deals to be made both for sellers and buyers of farm and ranch-style homes. Get A FREE Home Valuation Enter your email to receive a free, easy to read seller's guide on how to sell your house in the shortest time for the most money. " – Christian (Google Review). Get PDF Now.
Dear Sellers, the housing market misses you It’s tough to value properties today! Anyway, I don’t mind going back in time and out further, but my preference in an appraisal report is to use older comps from the immediate neighborhood and adjust for how the market has changed since those properties got into contract. percent from 6.93
We organize all of the trending information in your field so you don't have to. Join 9,000+ users and stay up to date on the latest articles your peers are reading.
You know about us, now we want to get to know you!
Let's personalize your content
Let's get even more personalized
We recognize your account from another site in our network, please click 'Send Email' below to continue with verifying your account and setting a password.


Let's personalize your content