This site uses cookies to improve your experience. To help us insure we adhere to various privacy regulations, please select your country/region of residence. If you do not select a country, we will assume you are from the United States. Select your Cookie Settings or view our Privacy Policy and Terms of Use.
Cookie Settings
Cookies and similar technologies are used on this website for proper function of the website, for tracking performance analytics and for marketing purposes. We and some of our third-party providers may use cookie data for various purposes. Please review the cookie settings below and choose your preference.
Used for the proper function of the website
Used for monitoring website traffic and interactions
Cookie Settings
Cookies and similar technologies are used on this website for proper function of the website, for tracking performance analytics and for marketing purposes. We and some of our third-party providers may use cookie data for various purposes. Please review the cookie settings below and choose your preference.
Strictly Necessary: Used for the proper function of the website
Performance/Analytics: Used for monitoring website traffic and interactions
Newly released data from the annual profile of home buyers and sellers by the National Association of Realtors (NAR) shows just how dramatically this trend has manifested since the financial crisis of 2008. While the median age of buyers gradually increased over the course of two decades, the COVID-19 pandemic sped it up.
As we close out 2022, it’s time to reflect on a historic year for the housing market, which was even crazier than the COVID-19 year of 2020. It is crazy to think we are seeing these four things happen in the housing market considering that even in March of this year we were seeing bidding wars accelerate before mortgage rates rose.
This data line lags the current housing market as it’s a few months old. Since 2014, we’ve not seen the credit housing boom that we saw from 2002-2005. The housing market can’t replicate the type of massive credit expansion we saw from 2002-2005, so the price-growth story has more to do with inventory collapsing to all-time lows.
To get the housing market to be sane and normal again, we need inventory to get back in a range between 1.52 – 1.93 million ; this is still historically low, but this gives the housing market a breather from the madness that we see today. One of the critical data lines that I want to see improve this year is days on market.
housing market and compare those to where we are today — in the middle of one of the most epic years in our country’s history, due to COVID-19. No doubt about it, the COVID crisis has taken some juice out of the 2020 housing market. The new home sales market is doing well as it really benefits from lower mortgage rates.
Marty Green thinks of the housing market in 2022 as two very different movies. ” Houses were selling at a fever pitch in a matter of days, with multiple offers, waived contingencies and buyers paying $100,000(!) But the housing market in the second half of 2022? A mortgage rate lockdown freezes the housing market.
The June housing starts data beat estimates with positive revisions, however, this doesn’t change the housing market recession call that I made last month. Some buyers had to wait forever before they could lock in their rate, meaning they didn’t qualify for their homes as rates moved up so fast.
Just when I thought days on market were returning to normal, that number for existing homes fell back down to 22 days. If the days on the market are at a teenager level or even lower, it’s never a good sign for the housing market. This is why the days on the market are so low historically after 2020. million, up from 1.03
million , with double-digit home-price growth driving a housing market that is still savagely unhealthy. Spoiler: If you haven’t realized that the housing market since 2012 has been trolled out by professional grifters who don’t ever forecast sales, that is on you. million and 1.93 Today inventory levels are at 1.02 I use the 1.52-1.93
I have been part of the mortgage banking industry since 1983 — 39 years to date through different housing markets. In many ways it was similar to today, with one exception: When I started, I hadn’t been spoiled by a housing market like the one in 2020 and 2021. The housing market won’t be like this forever.
Now, with five weeks of data in front of us, we can say they have stabilized the market. As you can see from the chart above, the last several years have not had the FOMO (fear of missing out) housing credit boom we saw from 2002-2005. The question then was: What would lower mortgage rates do to this data? Total inventory levels.
COVID didn’t get the housing market, but it did pull a fast one on those pesky bears. For the casual observers of the market, it may seem intuitive that with all the economic chaos we suffered during the first half of 2020, the housing market would take a drastic hit – from which it would be difficult to recover. Look, I get it.
Traditionally, housing starts, permits, and completions would move together, like what we saw in 2002-2005. From 2002-2005 it was a steady rise to the top of the housing bubble, and then it burst. This has nothing to do with the existing home sales market; this monthly supply data only applies the new home sales market.
However, the real story of 2022 is that the savagely unhealthy housing market continues as inventory is still lower than last year, sending home prices growth into double digits again. housing market; the 10-year is above 1.94%, something that didn’t happen in 2020 or 2021. million and 6.16 million in March.
We’ve all been wondering what 5% plus mortgage rates would do to the hot housing market, and now we’ve got that and a bag of chips. As a result, I’ve been rooting for mortgage rates to rise to create a balancing impact on this housing market. Have higher rates worked? Some data to consider: 1.
housing market has outperformed expectations, I expected these upward trends to moderate. Because this data looks out 30-90 days, we can get from these numbers that the market is still in make up demand mode. Because housing demand is at pre-cycle highs, we can infer home prices are not an issue for most buyers.
The housing market shifted in March of this year. Yes, crazy to think, but this is a survey trend data line, and the housing market was in free-fall at that time. That’s not the case now because we have’t had a credit boom post-2010 as we did from 2002 to 2005. housing market. What is going on here?
. “This is about the same rate of price growth that occurred during the 2002 through 2006 period when subprime lending drove exuberant housing demand. “But that is where the similarities end. Mortgage holders are well-qualified and subprime loans are rare. ”
In time, markets always find balance and balance is a good thing. One of the reasons that I moved into the “team higher mortgage rate” camp is that what I saw in January, February, and March of this year was so unhealthy that I labeled the housing market savagely unhealthy. Again, what happened in housing from 2002 to 2008?
Due to this reality, I have downgraded the housing market from unhealthy housing to a savagely unhealthy housing market. Logan Mohtashami: Rising rates make housing less affordable, so for a first-time home buyer that doesn’t have the benefit of selling their home with that nested equity, it makes it harder for them.
Census Bureau released their new residential construction report for April, showing a miss on the estimate and a negative revisions data line, which I believe is lagging behind the current market reality. We simply cannot finish homes in America promptly, and now that mortgage rates are over 5%, some buyers won’t be able to purchase a home.
Let’s keep it simple: total active listings are still below 2019 levels nationally, and the days on market are under 30 days today. However, what is different this year from 2023 is that we have more sellers that will be buyers. However, I can clear up any confusion on this topic.
housing market , we just experienced an event that most people never thought could happen. From NAR : “December was another difficult month for buyers, who continue to face limited inventory and high mortgage rates ,” said NAR Chief Economist Lawrence Yun. The days on market were too low.
We finally got mortgage rates to rise, and for people like me who have been concerned about how unhealthy the housing market was last year — and it got a lot worse this year — it’s a blessing that was much needed. This sector on an apples-to-apples basis is more expensive than the existing home sales market. The only risk to that 6.2
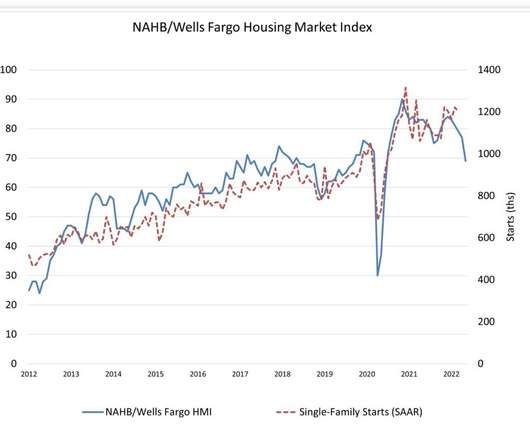
The data from the NAHB/Wells Fargo builder’s survey is always crucial because it is forward-looking, and it takes the reality of today’s market into the equation. As rates rise, this will impact the builders more as they try to find buyers for current homes in cancellation. From NAHB : From Census: Housing Permits Privately?owned
However, with active listings now near all-time lows, the builders’ new homes still have more value in the housing market than what we saw in previous decades. They can cut prices, pay down mortgage rates for their buyers, and do what they need to to make it work for them to move their products. When supply is 4.3
Of course, housing starts today aren’t collapsing in the way they did from the peak of 2005 because we haven’t had a sales credit boom in recent years as we did from 2002-2005, which inflated new home sales toward 1.4 The credit cycle looks much different now than the build-up from 2002-2005.
Many of the complaints and allegations about appraisals related to not addressing the changes happening in the market as the meltdown began to occur, calling the market stable when prices were starting to decline. Between 2002-2005 in many markets, the real estate market was scorching, much like it is today.
During plaintiff lead attorney Michael Ketchmark’s cross examination of Warner, he presented her with some statistics showing that HomeServices affiliated agents in four Missouri markets paid buyer broker commissions of roughly 3% in at least 88% of the transactions completed between 2015 and 2022. We don’t want people unrepresented.”
Then everyone went crazy on investors and iBuyers , suggesting that these people were holding up the entire housing market. I understand that grifters have to keep the grift going, but not even the Joker would say that the housing market lives off investors and not mortgage buyers. Home prices and days on market.
We had more housing starts during the bubble years because from 2002 to 2005 that demand curve was higher, but it was facilitated by unhealthy credit growth. People forget that housing construction is built on the need for new homes, which are more expensive than the existing home sales market. Housing completions.
The savagely unhealthy housing market theme of mine is running in full force now as we have gotten no relief on home prices and now have a mega jump in mortgage rates. . Since the summer of 2020, I have talked about what could change the housing market, which was a 10-year yield above 1.94%, which means rates over 4%. million to 1.28
But I need to explain why this level has more in common with 2014 housing data than the credit stress markets of 2005-2008, and why you should care. Understanding this data line and what it is trying to tell you will be more valuable than erroneously thinking the market is crashing and we’ll see a wave of foreclosures.
Tuesday, the new home sales report for March came in as a miss of estimates at 763,000, but the revisions were all positive, which shows that the housing data is still lagging behind the current market reality. The new home sales market doesn’t have a 28% cash-buyer profile as we saw in the last existing home sales report.
While the growth rate is cooling monthly, we are still in a savagely unhhealthy housing market trying to get national inventory levels back to pre-COVID-19 levels. However, we haven’t had a credit sales boom like the one we saw from 2002-2005. Nor can we ever have a credit sales boom again with lending standards back to normal.
There’s a showdown at the housing market corral between homebuyers and sellers. When I came up with the “ savagely unhealthy housing market ” label in February of this year, it was based on the premise that the housing inflation story that we have had to deal with since 2020 was a historical event.
In addition, some white neighborhoods had zoning laws that legally banned non-white buyers from owning homes in those neighborhoods. million new minority homeowners when the president launched the Blueprint for the American Dream in 2002. This means that the most likely buyer for many of these new retirees will be a minority family.
“The 30-year fixed-rate mortgage broke 7% for the first time since April 2002, leading to greater stagnation in the housing market,” Sam Khater, Freddie Mac’s chief economist, said in a statement. This translates to a whopping $1,000 increase in the typical home payment in just the last year,” Jones said in a statement. . “I
The housing market is in a recession, something that the homebuilders and the National Association of Realtors now agree with me on, as this recent CNBC clip shows. Over the years, I have tried to emphasize that the housing market in the U.S. can’t have a credit sales boom like we saw from 2002-2005. This is 12.6 percent (±16.9
The truth here that nobody wants to talk about is that we didn’t have a massive sales credit boom in housing from 2020-2021 like we saw from 2002-2005. That would reverse the problem the housing market has had selling homes with mortgage rates above 7%. months, and below, this is an excellent market for builders.
So, early in my career, I sought for ways to help would-be buyers, most being minorities, bridge the gap and achieve homeownership earlier. In the early 2000s, many — including myself — believed empowering someone with a home for sale to contribute to the buyer’s down payment was a small way to help deserving families.
Even in the extreme conditions of COVID-19, my general premise on housing economics predicted that the two variables with the most influence — demographics and mortgage rates — would hold up the housing market. We got to as low as 0.32% on that Monday morning in March when the crisis was hitting the markets the hardest. The forecast.
Our demographics were either too young or too old to be in the market to purchase homes. The loan profile of buyers during the post-2010 expansion is excellent, so when the next job loss recession happens, we won’t lose as many homeowners (compared to what occurred after the Great Recession). Going back to point No.
In 2002, when Dara Alperen Cipollone purchased her first home in East Boston, her real estate agent suggested she would be a great fit for residential sales. Some want me to summarize the market data and give concise guidance on market values. Q: What obstacles are Millennials facing in the Boston real estate market?
We organize all of the trending information in your field so you don't have to. Join 9,000+ users and stay up to date on the latest articles your peers are reading.
You know about us, now we want to get to know you!
Let's personalize your content
Let's get even more personalized
We recognize your account from another site in our network, please click 'Send Email' below to continue with verifying your account and setting a password.


Let's personalize your content